Inequality, Migration, and ‘Smart’ Survival Performance
скачать Автор: Tausch, Arno - подписаться на статьи автора
Журнал: Social Evolution & History. Volume 12, Number 2 / September 2013 - подписаться на статьи журнала
Abstract
In this article, we present a first empirical reflection on ‘smart survival’, its measurement and its possible ‘drivers’ and ‘bottlenecks’. The basic idea of ‘smart development’ was proposed by Dennis Meadows two decades ago and relates our whole concept of development to the natural resources needed to sustain it. We apply this reasoning to three central indicators of survival in public health research (female survival to age 65, infant mortality, and life expectancy). We relate these measures to the ecological footprint, needed by society to sustain the economic and social model, which permits their performance. Our study uses standard international aggregate statistical data on socio-economic development. We first show the OLS regression trade-offs between ecological footprints on our three outcome indicators of public health. The residuals from these regressions are our new empirical measures of smart survival. We then look at the cross-national drivers and bottlenecks of this ‘smart survival’. Our estimates underline the enormous importance of received worker remittances for smart survival. Inequality plays a certain role. Considering the ecological resources to sustain a societal model, migration is among the major determinants of public health outcomes.
BACKGROUND
In this article, we present a first empirical reflection on ‘smart development’, its measurement and its possible ‘drivers’ and ‘bottlenecks’. The very idea of ‘smart development’ was first proposed by Meadows (1992) and has not been really followed up to now in social science ever since. In the face of the huge usage of this term in the international media, such a statement is perhaps surprising, but our verdict corresponds to the clear bibliographical evidence on the base of such indices as ‘ISI Web of Knowledge’ or ‘Cambridge Scientific Abstracts/PROQUEST’.1
The basic idea, proposed by Meadows two decades ago, was that we should relate our whole concept of development, and not just economic growth, to the natural resources needed to sustain it. Arguably, ecological footprint today is the best single international yardstick for environmental destruction to be observed in a nation, and preferably should be used as the x-axis in any measure of the concept of ‘smart development’ (York et al. 2003). The y-axis then would be performance in public health, like life expectancy rates.
Following the path-breaking articles by R. G. Wilkinson and Picket (Wilkinson 1992, 1997; Wilkinson and Picket 2006), the income inequality has a very detrimental effect on life quality. But as we show in our article, ‘life quality’ or ‘survival’ also depends in a non-linear fashion on the environmental data. It would be senseless for a country to achieve, say, an average life expectancy of 85 years, even at moderate or low levels of social inequality at a very heavy ecological price of substantially further intensifying our ecological footprint here on earth (which measures how much land and water area human population requires to produce the resource it consumes and to absorb its carbon dioxide emissions, using prevailing technology).2 Ultimately, such an energy and resource intensive development will not be sustainable in the long run, and will backfire on life quality (human happiness) and life quantity (life expectancy).
But in a way, this exactly describes our alternatives today. Humanity already uses the equivalent of 1.5 planets to provide the resources we use and absorb our waste.3 If we continue what is called ‘progress’ in the 21st century not only life expectancy will have to be maximised and infant mortality will have to be minimised and human happiness would have to be further increased; all this ‘progress’ also would have to be achieved at the price of low and decreasing detrimental environmental consequences of our human life on our planet. ‘Smart development’ would combine a high life expectancy and a medium or low ecological footprint.
Arguably, the integration of the phenomenon of socio-economic inequality, which dominated politics and economy of the industrialized western democracies throughout much of the late 19th and 20th century into current thinking about public health, has been a major scientific achievement. But in addition to fundamentally overlooking the environmental question, current thinking of the inequality-centred school of public health overlooks such important phenomena of the 21st century as migration, and the globalization of cultures and religions, brought along with global migration, which will all increasingly influence politics and economy of our globe and of course also potentially shape public health performance. Our article should serve exactly the public health research profession to face up to these new challenges of the 21st century.
The vast social science debate about migration as one of the possible future drivers of public health developments can only be briefly summarized here. The number of international migrants has increased more or less linearly over the past 40 years, from an estimated 76 million in 1965 to 188 million in 2005 (Taylor 2006). The flow of international migrant remittances has increased more rapidly than the number of international migrants, from an estimated US$ 2 billion in 1970 to US$ 216 in 2004. Nearly 70 % of all remittances go to LDCs. Worker remittances are especially affecting the less developed sending countries by the multiplier effect, well-known in economics since the days of the economist John Maynard Keynes (Taylor 1999). Countries with per capita income below US$ 1200 benefit most from remittances in the long run because they have the largest impact of remittances on savings (Ziesemer 2009). An important benefit of remittances is that less debt is incurred and less debt service is paid by countries than without remittances. Financial remittances are vital in improving the livelihoods of millions of people in developing countries (Human... 2009). There is a positive contribution of international remittances to household welfare, nutrition, health and living conditions in places of origin. An important function of remittances is to diversify sources of income and to cushion families against setbacks such as illness or larger shocks caused by economic downturns, political conflicts or climatic vagaries. In the comprehensive sociological literature, there have been already made attempts to bring in migration as a determining variable of social well-being (Sanderson 2010). Contemporary levels of international migration in less-developed countries are raising new and important questions regarding the consequences of immigration for human welfare and well-being. This mentioned study assessed the impact of cumulative international migration flows on the human development index, the composite, well-known UNDP (United Nations Development Programme) measure of aggregate well-being.
In our own work, we also consider the potential negative effects of state sector intervention into the economy on social (here ecologically weighted public health) performance. In addition, we also look at the explanatory power of other standard international development predictors, well-known in the economic, political science and macro-sociological literature (Tausch et al. 2012).
METHODS
Confronting these multiple tasks to develop a timely understanding of the determinants of ecologically weighted public health performances, and keeping with a vast tradition in the social sciences, which relates development performance in a non-linear fashion to achieved income levels,4 we stipulate first that a is the constant in a standard, ordinary least square multiple regression equation, b1 and b2 are the unstandardised regression coefficients, and e denotes the error term. e is the well-known mathematical number 2.72 and p is the well-known mathematical number 3.14… We should recall that (1/e2) corresponds to a numerical value of 0.14 and (ln (p)) to a numerical value of 1.14...5 We have then accordingly:
Public health performance = a +- b1 * ecological footprint(1/e2) -+ b2 * ecological footprint(ln (p)) + e (Equation 1)
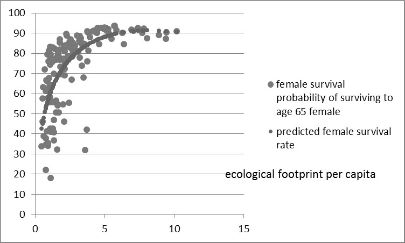
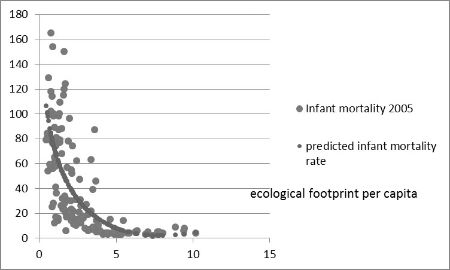
In our essay, we use a recent standard international data set about globalization and development, which is freely available world-wide and which relies on well-established international data sources, such as the United Nations Development Programme, the World Bank, the International Monetary Fund, and the International Labour Organization, to test our propositions.6 We demonstrate7 the trade-off between ecological footprint and life quality, taking female survival rates to age 65, infant mortality and life expectancy as examples in Graph 1.
Data source: http://www.hichemkaroui.com/?p=2017#more-2017. Accessed on February 27, 2012.
Data source: http://www.hichemkaroui.com/?p=2017#more-2017. Accessed on February 27, 2012.
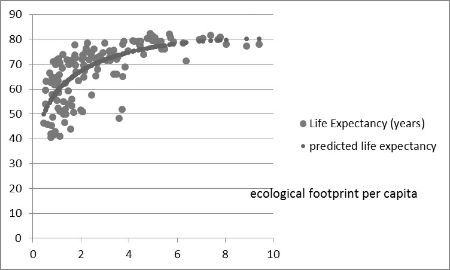
Graph 1c. Life expectancy and ecological footprint
Data source: http://www.hichemkaroui.com/?p=2017#more-2017. Accessed on February 27, 2012.
Table 1 (see Appendix) shows the predicted values and the quality of our predictions (residuals) for female survival rates, infant mortality rates, and life expectancies (see Equation 1). By the residuals from our non-linear function, to be seen in Graphs 1a – 1c, we also present to our readers our new measures of ‘smart survival’. Good public health performance is also smart public health performance, if it is achieved at a low level of ecological footprint. Good or mediocre, let alone bad public health performance is un-smart public health performance, if it is achieved at a high or medium level of ecological footprint.
Analysing Table 1, our readers will find for example that the first country in the alphabet with complete data is Albania, which has an annual ecological footprint of 2.23 gha per capita. The female survival rate in a country with such a footprint level, corresponding to the international standard function, clearly visible in Graph 1a, would have to be expected at somewhere about 75 %. But in reality Albania's female survival rate to age 65 was 89.5 % in the first decade of the new millennium, and thus somewhere 14.7 % above the value, which would have been to be expected.
Several developing countries by far outperform richer countries in achieving good or medium public health results at a low or moderate ecological footprint rates per capita, while many rich countries – among them several established Western welfare states with low socio-economic inequality rates – perform relatively bad public health results, and consume a considerable amount of energy and resources to achieve their survival performances. The real ‘superstars’ of ‘smart survival performance’ regarding infant mortality in comparison to ecological footprint are countries like Sri Lanka, the Philippines, and Jamaica. Similar trends and country results hold also for our other indicators in question.
What determines these performances? Is it inequality? Many of the countries with a good performance on our smart survival scales are developing countries with high degrees of inequality, like the Philippines, Colombia or Peru.
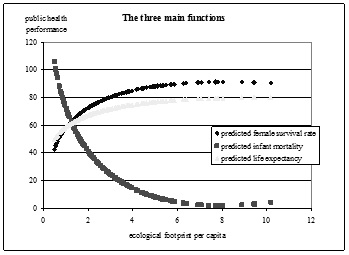
To further allow our readers a deeper understanding of the mathematical functions used in our research, we elaborated Table 2 (see Appendix), which shows the mathematical properties of the trade-offs between ecological footprint and life quality, each time applying Equation 1. Table 2 is the appropriate compendium of the mathematical functions of our study, determining the shape of Graphs 1a – 1c and also the results of Table 1.
Graph 2 presents the synopsis of the mathematical functions used in our study.
Apart from the quintile share of income inequality, which is the difference in the absolute incomes of the richest 20 % and poorest 20 % in society, we used standard development predictors in our equations, often used in international development accounting. The following ones achieved significant results:
|
1. Membership in the Organization of Islamic Cooperation (De Soysa and Ragnhild 2007). 2. Military expenditures per GDP (Auvinen and Nafziger 1999; Heo 1998). 3. Muslim population share per total population (Acemoglu et al. 2002; Ram 1997). |
4. Public education expenditure per GNP (Blankenau and Sympson 2004; Ram 1986; Sylwester 2000). 5. UNDP education index 6. Worker remittance inflows as % of GDP (Acosta et al. 2008). |
In our calculations, we first tested the stepwise standard OLS multiple regression results of these variables on our smart survival performance indicators.8 The insignificant predictors were weeded out; and the final models included only the significant predictors, and are based on standard stepwise OLS forward regressions.
RESULTS
Our calculations9 about the comparative effects of standard econometric, public health, and social science predictors of global social and economic performance show that inequality, as correctly predicted by R. G. Wilkinson and his school of public health research still has detrimental effects, but that the effects are not as huge as expected, once we properly control for the other intervening variables.10
The full statistical results of our research are presented in Tables 3–5 in Appendix.
CONCLUSIONS AND IMPLICATIONS
Considering the fact that high infant mortality rates are socially and politically undesirable results, we arrive at the following generalized interpretations implicit from Tables 3–5. All these results have considerable implications for risk assessment in international health policy.
There are very clear-cut results for the socio-cultural phenomena of migration: received worker remittances and the share of Muslims per total population are positive and significant drivers of the performance-related indicators.11 The Muslim population shares have a net and significant positive effect on smart life expectancy and also smart female survival rates, irrespective of the effects of the other intervening variables.12 This result supports a social scientific research tradition, which recognizes the development potentials of Islamic civilizations. At the same time our research is aware about the hitherto existing growth and energy savings constraints in many Muslim countries, especially in the Arab world, brought about by the rentier character of these states and their dependence on the hitherto existing oil wealth and the lack of democracy in the region, which existed for many decades, and which might be changing now (see also the optimistic study by Noland and Pack 2007). Interestingly enough, the real net effect of Islamic civilization, measured by Muslim population shares per total population, is positive, while membership in the Organization of Islamic Cooperation (OIC), an organization of existing states in the existing world system, has significant negative effects on smart female survival and smart life expectancy. To be exact, we do not say that membership in the Organization of Islamic Cooperation (OIC) as such has a statistically significant negative effect on female survival and life expectancy. The effect is rather on smart female survival and smart life expectancy; considering the level of ecological footprint at given technologies and political patterns in a given country with given levels of female survival and life expectancy. An important intervening variable is the hitherto existing energy-intensive development paths in many OIC member countries and the necessity of a ‘greening’ of the member countries of the OIC (on energy policy in the Arab world see Reiche 2010). Put in other words – to achieve a reasonable life expectancy and good other survival data, OIC nations need a lot of energy.
The significant effects for worker remittances (see unstandardised regression coefficients, see Tables 3–5) on smart survival are dramatic, and all in the desired direction, with one per cent increase in received worker remittances moving up smart female survival rates by 0.5 per cent, and resulting in a reduction of unsmart infant mortality rates by 1.3 points. Also, a 1 % increase in received worker remittances increases smart life expectancy by 0.3 years. Reaping the benefits from one of the four freedoms of the ‘capitalist’ order – migration – has absolutely beneficial effects on our environmentally weighted survival performance scales.
Large sections of current economic theory are vindicated by the positive significant effects of human capital formation (operationalized here by the UNDP education index) on smart survival. High military expenditures per GDP and high public education expenditures per GDP crowd out smart survival (see especially Blankenau and Simpson 2004).
There are two significant empirical effects to be recorded for the original Wilkinson approach: the significant negative effect of inequality on smart female survival and on smart life expectancy. Thus, the Wilkinson research agenda still finds its proper place also in the coming new and necessary debates about ‘smart development’, but certainly, the weight of other variables also has to be properly taken into account, such as
· membership in the Organization of Islamic Cooperation;
· military expenditures per GDP;
· Muslim population share per total population;
· public education expenditure per GNP;
· UNDP education index;
· worker remittance inflows as % of GDP.
A particularly promising area of future scholarship on the subject could be the question, as to whether the ‘social capital’ of voluntary organizations, as already specified in a very influential study (see Kawachi et al. 1997) is responsible for the explanation of the some 60 % to 70 % of the variance of smart survival rates, still unaccounted for by our models. At any rate, we hope that we have contributed a novel perspective to the paths of inequality oriented survival rate indicator performance research in public health.
1 Accessed via Vienna University Library, April 24th, 2012.
2 URL: http://www.footprintnetwork.org/en/index.php/gfn/page/footprint_basics_ overview/ [accessed February 27, 2012].
3 URL: http://www.footprintnetwork.org/en/index.php/GFN/page/world_foot print/ [accessed February 27, 2012].
4 For a survey of the literature, see, among others Tausch and Prager 1993. Following an essay by Goldstein (1985) there were many empirical attempts to capture this trade-off. The empirical function we use in this essay has been taken from (Tausch and Prager 1993).
5 All these numbers are well-known constants from general mathematical systems theory. See also Bronstein and Semendjajew 1972.
6 URL: http://www.hichemkaroui.com/?p=2017 [accessed February 27, 2012].
7 Statistical software used: SPSS/IBM XVIII [http://www-01.ibm.com/soft ware/analytics/spss/] [accessed February 27, 2012].
8 See URL: http://www.hichemkaroui.com/?p=2017 [accessed February 27, 2012] for the data definitions and sources.
9 Standard econometric development accounting is to be found, among others, in Barro and Sala-i-Martin 2003.
10 Prior stepwise regression procedure with the most important predictors, commonly used today in econometrics and political science. The significant predictors were retained for the final results, reported here, which are based on forward regression and the standard default SPSS XVIII multiple regression options.
11 This is especially relevant for researchers in Europe. In the widely received work by Sarrazin (2010), it is maintained that Muslim diasporas are to be blamed for a great number of social and economic problems in countries like Germany. Our empirical results, by contrast, suggest that the social cohesion of Muslim life in the Diasporas is a positive asset for smart survival rates.
12 A good reason, why Muslim population shares wield such effects on our variable, is the phenomenon of social cohesion and social trust in these societies (see Tausch and Heshmati 2009). What has been described in classic Arab literature as ‘Asabiyya’ (social trust, social cohesion, social capital) is of course not new for the public health profession (see Kawachi et al. 1997).
Acemoglu, D., Johnson, S., and Robinson, J.
2002. Reversal of Fortune: Geography and Institutions in the Making of the Modern World Income Distribution. Quarterly Journal of Economics 117: 1231–1294.
Acosta, P., Calderon, C., Fajnzylber, P., and Lopez, H.
2008. What is the Impact of International Remittances on Poverty and Inequality in Latin America? World Development 36(1): 89–114.
Auvinen, J., and Nafziger, E. W.
1999. The Sources of Humanitarian Emergencies. Journal of Conflict Resolution 43(3): 267–290.
Barro, R. J., and Sala-i-Martin, X.
2003. Economic Growth. 2nd ed. Cambridge, MA: MIT Press.
Blankenau, W. F., and Simpson, N. B.
2004. Public Education Expenditures and Growth. Journal of Development Economics 73(2): 583–605.
Bronstein, I. N., and Semendjajew, K. A.
1972. Taschenbuch der Mathematik. 12th ed. Frankfurt and Zurich: Harri Deutsch.
De Soysa, I., and Ragnhild, N.
2007. Islam's Bloody Innards? Religion and Political Terror, 1980–2000. International Studies Quarterly 51(4): 927–943.
Goldstein, J.
1985. Basic Human Needs: The Plateau Curve. World Development 13(5): 595–609.
Heo, U.
1998. Modeling the Defense-Growth Relationship around the Globe. Journal of Conflict Resolution 42(5): 637–657.
Human Development Report
2009. Overcoming Barriers: Human Mobility and Development. URL: http://hdr.undp.org/en/reports/global/hdr2009/
Kawachi, I., Kennedy, B. P., Lochner, K., and Prothrow-Stith, D.
1997. Social Capital, Income Inequality, and Mortality. American Journal of Public Health 87(9): 1491–1498. DOI: 10.2105/AJPH.87.9.1491.
Meadows, D. H.
1992. Smart Development, Not Dumb Growth. Technology Review, 95(6): 68–89.
Noland, M., and Pack, H.
2007. The Arab Economies in a Changing World. Washington, D.C.: Peterson Institute for International Economics.
Ram, R.
1986. Government Size and Economic Growth. A New Framework and Some Evidence from Cross-Section and Time-Series Data. American Economic Review 76(1): 191–203.
1997. Tropics and Development: An Empirical Investigation. World Development 25(9): 1443–1452.
Reiche, D.
2010. Energy Policies of Gulf Cooperation Council (GCC) Countries – Possibilities and Limitations of Ecological Modernization in Rentier States. Journal of Energy Policy 38(5): 2395–2403.
Sanderson, M.
2010. International Migration and Human Development in Destination Countries: A Cross-National Analysis of Less-Developed Countries, 1970–2005. Social Indicators Research 96(1): 59–83.
Sarrazin, Th.
2010. Deutschland Schafft sich ab. Wie Wir Unser Land aufs Spiel Setzen. Munich: DVA.
Sylwester, K.
2000. Income Inequality, Education Expenditures, and Growth. Journal of Development Economics 63(2): 379–398.
Tausch, A., and Prager, F.
1993. Towards a Socio-Liberal Theory of World Development. Basingstoke and New York: Palgrave Macmillan/Saint Martin's Press.
Tausch, A., and Heshmati, A.
2009. Asabiyya: Re-Interpreting Value Change in Globalized Societies. Institute for the Study of Labour, Bonn, FRG. Discussion Papers 4459. URL: http://papers.ssrn.com/sol3/papers.cfm?abstract_id= 1489282
Tausch, A., Heshmati, A., and Brand, U.
2012. Globalization, the Human Condition and Sustainable Development in the Twenty-First Century. Cross-national Perspectives and European Implications. London, New York and Delhi: Anthem Press.
Taylor, J. E.
1999. The New Economics of Labour Migration and the Role of Remittances in the Migration Process. International Migration 37(1): 63–88.
2006. International Migration and Economic Development. International Symposium on International Migration and Development, Population Division, Department of Economic and Social Affairs, United Nations Secretariat, Turin, Italy, 28–30 June, 2006. URL: http://www.un. org/esa/population/migration/turin/Symposium_Turin_files/P09_SYMP_Taylor.pdf
York, R., Rosa, E. A., and Dietz, T.
2003. Footprints on the Earth: The Environmental Consequences of Modernity. American Sociological Review 68(2): 279–300.
Wilkinson, R. G.
1992. For Debate – Income Distribution and Life Expectancy. British Medical Journal 304(6820): 165–168.
1997. Socioeconomic Determinants of Health – Health Inequalities: Relative or Absolute Material Standards? British Medical Journal 314(7080): 591–595.
Wilkinson, R. G., and Picket, K. E.
2006. Income Inequality and Population Health: A Review and Explanation of the Evidence. British Medical Journal 62(7): 1768–1784.
Ziesemer, T. H. W.
2009. Worker Remittances and Growth: The Physical and Human Capital Channels. Jahrbűcher fűr Nationalökonomie und Statistik 229(6): 743–773.
| | | | | | | | |
|
Albania | | | | | | | |
|
Algeria | | | | | | | |
|
Angola | | | | | | | |
|
Argentina | | | | | | | |
|
Armenia | | | | | | | |
|
Australia | | | | | | | |
|
Austria | | | | | | | |
|
Azerbaijan | | | | | | | |
|
Bangladesh | | | | | | | |
|
Belarus | | | | | | | |
|
Belgium | | | | | | | |
|
Belize | | | | | | | |
|
Benin | | | | | | | |
|
Bhutan | | | | | | | |
|
Bolivia | | | | | | | |
|
Bosnia and Herzegovina | | | | | | ||
|
Botswana | | | | | | | |
|
Brazil | | | | | | | |
|
Bulgaria | | | | | | | |
|
Burkina Faso | | | | | | | |
|
Burundi | | | | | | | |
|
Cambodia | | | | | | | |
|
Cameroon | | | | | | | |
|
Canada | | | | | | | |
|
Central African Republic | | | | | | | |
|
Chad | | | | | | | |
|
Chile | | | | | | | |
|
China | | | | | | | |
|
Colombia | | | | | | | |
|
Congo | | | | | | | |
|
Congo (Democratic Republic of the) | | | | | | | |
|
Costa Rica | | | | | | | |
|
Croatia | | | | | | | |
|
Cuba | | | | | | | |
|
Cyprus | | | | | | | |
|
Czech Republic | | | | | | | |
|
Denmark | | | | | | | |
|
Djibouti | | | | | | | |
|
Dominican Republic | | | | | | | |
|
Ecuador | | | | | | | |
|
Egypt | | | | | | | |
|
El Salvador | | | | | | | |
|
Estonia | | | | | | | |
|
Ethiopia | | | | | | | |
|
Finland | | | | | | | |
|
France | | | | | | | |
|
Georgia | | | | | | | |
|
Germany | | | | | | | |
|
Ghana | | | | | | | |
|
Greece | | | | | | | |
|
Guatemala | | | | | | | |
|
Guinea | | | | | | | |
|
Guyana | | | | | | | |
|
Haiti | | | | | | | |
|
Honduras | | | | | | | |
|
Hong Kong, China (SAR) | | | | | | | |
|
Hungary | | | | | | | |
|
Iceland | | | | | | | |
|
India | | | | | | | |
|
Indonesia | | | | | | | |
|
Iran | | | | | | | |
|
Ireland | | | | | | | |
|
Israel | | | | | | | |
|
Italy | | | | | | | |
|
Jamaica | | | | | | | |
|
Japan | | | | | | | |
|
Jordan | | | | | | | |
|
Kazakhstan | | | | | | | |
|
Kenya | | | | | | | |
|
Korea (Republic of) | | | | | | | |
|
Kuwait | | | | | | | |
|
Kyrgyzstan | | | | | | | |
|
Laos | | | | | | | |
|
Latvia | | | | | | | |
|
Lebanon | | | | | | | |
|
Lithuania | | | | | | | |
|
Luxembourg | | | | | | | |
|
Macedonia | | | | | | | |
|
Madagascar | | | | | | | |
|
Malawi | | | | | | | |
|
Malaysia | | | | | | | |
|
Mali | | | | | | | |
|
Malta | | | | | | | |
|
Mauritania | | | | | | | |
|
Mexico | | | | | | | |
|
Moldova | | | | | | | |
|
Mongolia | | | | | | | |
|
Morocco | | | | | | | |
|
Mozambique | | | | | | | |
|
Myanmar | | | | | | | |
|
Namibia | | | | | | | |
|
Nepal | | | | | | | |
|
Netherlands | | | | | | | |
|
New Zealand | | | | | | | |
|
Nicaragua | | | | | | | |
|
Niger | | | | | | | |
|
Nigeria | | | | | | | |
|
Norway | | | | | | | |
|
Pakistan | | | | | | | |
|
Panama | | | | | | | |
|
Paraguay | | | | | | | |
|
Peru | | | | | | | |
|
Philippines | | | | | | | |
|
Poland | | | | | | | |
|
Portugal | | | | | | | |
|
Romania | | | | | | | |
|
Russia | | | | | | | |
|
Rwanda | | | | | | | |
|
Saudi Arabia | | | | | | | |
|
Senegal | | | | | | | |
|
Sierra Leone | | | | | | | |
|
Singapore | | | | | | | |
|
Slovakia | | | | | | | |
|
Slovenia | | | | | | | |
|
South Africa | | | | | | | |
|
Spain | | | | | | | |
|
Sri Lanka | | | | | | | |
|
Sudan | | | | | | | |
|
Sweden | | | | | | | |
|
Switzerland | | | | | | | |
|
Syria | | | | | | | |
|
Tajikistan | | | | | | | |
|
Tanzania | | | | | | | |
|
Thailand | | | | | | | |
|
Togo | | | | | | | |
|
Trinidad and Tobago | | | | | | | |
|
Tunisia | | | | | | | |
|
Turkey | | | | | | | |
|
Uganda | | | | | | | |
|
Ukraine | | | | | | | |
|
United Arab Emirates | | | | | | | |
|
United Kingdom | | | | | | | |
|
United States | | | | | | | |
|
Uruguay | | | | | | | |
|
Uzbekistan | | | | | | | |
|
Venezuela | | | | | | | |
|
Vietnam | | | | | | | |
|
Yemen | | | | | | | |
|
Zambia | | | | | | | |
|
Zimbabwe | | | | | | | |
| | | | | | | |
|
Female survival |
Constant | | | | | |
|
footprint per capita (1/e2) | | | | | | |
|
footprint per capita (ln (p)) | | | | | | |
|
statistical parameters of the equation | | | | | | |
| | | | | | ||
| | | | | | ||
| | | | | | ||
|
Infant mortality |
Constant | | | | | |
|
footprint per capita (1/e2) | | | | | | |
|
footprint per capita (ln (p)) | | | | | | |
|
statistical parameters of the equation | | | | | | |
| | | | | | ||
| | | | | | ||
| | | | | | ||
|
Life expectancy |
Constant | | | | | |
|
footprint per capita (1/e2) | | | | | | |
|
footprint per capita (ln (p)) | | | | | | |
|
statistical parameters of the equation | | | | | | |
| | | | | | ||
| | | | | | ||
| | | | | |
| | | | | | |
|
Constant | | | | | |
|
Membership in the Organization of Islamic Cooperation | | | | | |
|
Military expenditures per GDP | | | | | |
|
Public education expenditure per GNP | | | | | |
|
UNDP education index | | | | | |
|
Worker remittance inflows as % of GDP | | | | | |
|
Muslim population share per total population | | | | | |
|
Quintile share income difference between the richest and the poorest 20 % | | | | | |
Note: adj. R^2 = 0.453; n = 88; F = 11.311; error p = .000.
| | | | | | |
|
Constant | | | | | |
|
Membership in the Organization of Islamic Cooperation | | | | | |
|
Military expenditures per GDP | | | | | |
|
Public education expenditure per GNP | | | | | |
|
UNDP education index | | | | | |
|
Worker remittance inflows as % of GDP | | | | | |
|
Muslim population share per total population | | | | | |
|
Quintile share income difference between the richest and the poorest 20 % | | | | | |
Note: adj. R^2 = 0.316; n = 88; F = 6.745; error p = .000.
| | | | | | |
|
Constant | | | | | |
|
Membership in the Organization of Islamic Cooperation | | | | | |
|
Military expenditures per GDP | | | | | |
|
Public education expenditure per GNP | | | | | |
|
UNDP education index | | | | | |
|
Worker remittance inflows as % of GDP | | | | | |
|
Muslim population share per total population | | | | | |
|
Quintile share income difference between the richest and the poorest 20 % | | | | | |
Note: adj. R^2 = 0.411; n = 88; F = 9.684; error p = .000.
Размещено в разделах