Is Geography ‘Dead’ or ‘Destiny’ in a Globalizing World? A Network Analysis and Latent Space Modeling Approach of the World Trade Network
скачать Автор: Howell, A. - подписаться на статьи автора
Журнал: Journal of Globalization Studies. Volume 4, Number 2 / November 2013 - подписаться на статьи журнала
Drawing on advancements made in network analysis, statistical modeling and computer science, this paper employs latent space modeling techniques to explore the role of geography in the global trade economy. Latent space models postulate that the probability of a link between pairs of actors depends on the distance between them in unobserved Euclidean social space and on observed covariates. Using probabilistic models, I investigate the effect that distance has on influencing trade ties in social space, while also controlling for several covariates, including region-based homophily (a proxy for regionalization), transitivity and country wealth. The findings are posited within the ‘Geography is Dead’ thesis and reveal that the distance-destroying result attributed to globalization may be over-estimated in the global trade economy.
Keywords: network analysis, latent space model, world trade network, geo-graphy, regionalization, globalization.
1. Introduction
Since Toffler (1970) first argued that place is no longer an important determinant due to the evolution of transport and communication systems, numerous scholars have speculated the ‘death of geography’, giving rise to a heated debate (Ohmae 1990, 1995; Friedmann 2005). O'Brian (1992) proclaimed that the globalization era equates to ‘the end of geography’, because geographical location no longer matters for economic development due to the increasing rate of globalization. In this context, globalization is defined as ‘the deepening integration of global economic activity facilitated by the rapid development of information and communications technology and the underlying trend towards liberalization in trade and investment’ (Staples 2007: 99).
Despite the ‘geography is dead’ claims, many notable (economic) geographers emphasize the critical role of geography in trade, as well as in innovation, knowledge and development (Krugman 1993; Yeung 1998; Massey 1984, 1999; Morgan 2004). It is well known that the effects of globalization are not distributed uniformly throughout the global economy, and there are place- and region-based variations that require a geographical lens in order to understand issues of unequal development (Warwick 2005). Moreover, the growing forms of regionalization shed further evidence that geography does matter for trade and economic development. Regionalization is defined here as a process, ‘whereby economic interaction, such as flows of goods and capital, increase faster among countries within a particular geographical area than between those countries and others outside the area’ (Moore 2007: 36).
In the present paper, I apply latent space modeling – developed by Hoff et al. (2002) – to test the ‘geography is dead’ thesis. Hoff et al. (2002) postulate that the probability of a link between pairs of actors depends on the distance between them in unobserved Euclidean social space and on observed covariates. Using the latent space modeling approach, I investigate the effect that distance has on trade ties in latent space, while also controlling for several covariates, including region-based homophily (a proxy for regionalization), transitivity and country wealth.
Stochastic models can be used to identify the specific processes that have led the network to its particular configuration. Both the gravity model and the exponential random graph model (ERGM) are possible approaches to test the relationship between geography and trade. Aside from weak theoretical backing, another main shortcoming with these approaches is that they assume independence among all trade linkages between country pairs. In reality, it is very likely that there is inherent dependency between ties (Shortreed et al. 2006). For example, if South Africa and Brazil are trade partners, and China and Brazil are trade partners, then it is more likely that South Africa and China are trade partners then it is if these previous trade relationships did not exist.
By implementing proxies to take into account second- and third-order dependences in the network, the latent space model is one method to deal with this dependency.
This paper attempts to add to the growing literature on the World Trade Network (WTN), as well as to test the ‘death of geography’ thesis, by statistically analyzing the role of geography and trade integration using latent space stochastic models. To carry out these objectives, I estimate several simple latent space models to capture the relationship between distance and the likelihood of two countries establishing a trade partnership in the WTN, while also taking into account higher order dependencies in the network. Results from the analysis support regionalization, in favor of the ‘geography is destiny’ thesis (Dieter 2007), implying that proponents of the ‘geography is dead’ overestimate the distance-destroying effects of globalization on the global trade economy.
The outline of this paper is as follows. In the subsequent section, I provide a brief background on relevant network analysis studies. In Section 3, I discuss issues related to building, specifying and representing the trade network. In Section 4, I provide an overview of the main network statistics and network properties commonly used to infer patterns in the trade network. Specifically, I consider connectivity, centrality, clustering and hierarchy, as well as homophily and transitivity. In Section 5, I specify several latent space models and test the principles of propinquity, homophily and transitivity. Lastly, Section 6 concludes with some final remarks.
2. Background
Due to advancements in physics and computer science, network analysis is increasingly relied upon to study the world trade network and is a powerful tool that can be used to reveal topological properties, as well as the underlying structure of the trade network (Fagiolo et al. 2009; Reyes et al. 2007, 2010). For instance, network analysis applications of the world trade network (WTN) have most notably addressed two major questions: (1) does the trade network follow a core-periphery structure (Clark 2008, 2010; Kali and Reyes 2007); and (2) do global elites tend to trade among themselves and what are the effects of international trade on economic growth (Bhattacharya et al. 2008; Serrano 2008; Fagiolo et al. 2009).
Although comparatively underdeveloped, network analysis has also been employed to investigate the role of geography in the global trade economy. Kim and Shin (2002) argue that network analysis can naturally be extended from dependency/world-systems theory to test the globalization vs. regionalization thesis that indirectly tests the role of geography by determining whether countries in the network are globalizing or regionalizing (Aggarwal and Koo 2005; Kim and Shin 2002; He and Deem 2010).
Findings from network analysis contribute to the debate over whether regionalization is a stepping stone or stumbling block to globalization (Bhagwati et al. 1999). On the one hand, some scholars believe that regionalization is a transitory step that some countries pursue to become more competitive on the global market, eventually promoting globalization and rendering geography unimportant. On the other hand, other scholars suggest that regionalization impedes globalization by hurting the welfare of non-member countries and leading to inefficient production strategies that may work at the regional scale but not at the global scale.
For instance, Kastelle et al. (2006) provides evidence that the ‘movement of trade, capital and people is a geographically heterogeneous and historically episodic process and can be interpreted to support regionalization rather than globalization’. The authors' finding is significant because it highlights the power of geography to influence trade outcomes; even in an ever-increasing globalized world, countries still pursue regional trade integration policies with nearby countries.
Conversely, Kim and Shin (2002) argue that globalization and regionalization are not necessarily competitive, but complementary processes. From 1959–1996, the authors show that the WTN became globalized (overall network density increased significantly), while it also became regionalized (intraregional density also significantly increased). Based on their findings, the authors suggest that regionalization does not jeopardize globalization; rather the two processes are complimentary and can coincide with one another.
While the authors' findings have far reaching implications into the effects of regionalization and globalization on the global economy, the findings are predicated merely on descriptive statistics, in this case, a network statistic called node degree. Node degree measures the probability of a randomly chosen vertex to have k-connections to other vertices and provides a summary of a node's overall activity.1 The problem with this network statistic, like any other descriptive statistic, is that no statistical model is used to control for other potential intermediating variables that may influence the outcome of a trade tie being established.
Most of the literature on the WTN only examines the network's summary statistics to track topological changes, and few attempts are made to statistically analyze the trade network using stochastic models (notable exceptions are Garlaschelli and Loffredo 2005; Garlaschelli et al. 2007). Fitting statistical models to networks, in general, is still in its infancy stages due to the complexity of modeling networks and the high level of computation that is required (Hunter and Handcock 2005). It is not surprising, therefore, that the WTN literature has only recently begun to be modeled; despite the complicated nature of the WTN, pertinent topological properties of the global trade system can and should be extracted through modeling the system as a network (Serrano 2008).
3. The Network Data: Specification and Representation
Bilateral trade data are extracted from the United Nations COMTRADE database. Data for GDP per capita and the trade/GDP share are extracted from Penn World Table 6.2 (for a country listing, see Appendix). In the trade network, countries represent nodes and the links between two countries are their shared imports and exports. If a trade tie is not present, then yij = 0. The data offer information on both exports and imports, however, I use only import data because previous scholars suggest that these figures are more accurate than export figures (Kim and Shin 2002).
A network can be set up as some combination of binary/weighted, directed/undi-rected and static/longitudinal. For the purposes of this research, I build a binary, undirected and static network. These specifications are chosen for the following reasons: (1) Squartini et al. (2011) specify various combinations of the network and find that the projections made by the binary matrix are maximally informative and should be the focus of subsequent models of trade; (2) the number of in and out ties are highly correlated, and in accordance with Fagiolo et al. (2009) and Serrano and Boguna (2003), the WTN is sufficiently symmetric to use an undirected analysis; and (3) while the descriptive statistics may change as new countries are incorporated into the network and trade relationships are established and/or strengthened, it is likely that the underlying processes that generate the network are likely to be stable over time (Schiavo et al. 2010). To avoid the complexities of using longitudinal data, it is suffice to select a stochastic model for a single year, 2008, to examine the statistical properties of the WTN.
Network Representation
Graph theory, advanced by Harary and his collaborators (Harary 1959; Harary et al. 1965), is used to inform much of what we know about how networks work. A graph is a network model consisting of dichotomous (binary) relations. The network can be represented with the following graph notation:
G = (V, E)
where V is a vertex set, V = {υ1, …, υ2}, and in the undirected graph, E Í {(υi, υj) : υi, υj Î Î V}. In the undirected case, if country i exports to country j or country j exports to country i, then yij = 1. Countries represent vertices, and edges between any two countries (υi, υj) exist if at least one million U.S. dollars in trade is transacted during the year in observation. The one million U.S. dollar threshold is common in the WTN literature (Kim and Shin 2002) and is selected in order to focus on significant trade relationships that shape the network.
I set Y to be the adjacency matrix for the random graph G. yij is a binary random variable which indicates the state of the i, j edge. The Pr (y↓ij = y↓ij) is the probability of the yij edge state. I can express yij in terms of the WTN as a dichotomous outcome:
yij =
The density of a network is the proportion of present ties to the maximum possible lines in a graph. A gXg nodal graph can be computed as:
The density for the WTN in 2008 is .59, which means based on the number of nodes, trade ties represent approximately 59 per cent of the total possible. There are 7,177 mutual ties in 2008, but 2,799 asymmetric trade ties. Germany, the U.S., and China are the biggest traders averaging around US $8 billion to each of its trading partners. Almost 40 per cent of countries export something to almost every other country, and every country exports to at least 20 other countries, indicating that the trade network is very concentrated.
Table 1
Network statistics for 2008
2008
|
Countries Reporting Trade |
190 |
|
Graph Density |
.59 |
|
Total number of dyad trade ties |
7 177 |
|
Total number of asymmetric trade ties |
2 799 |
|
Countries making up 50 % of exports |
9 |
Source: Author's calculations using COMTRADE database on reported trade 2008.
4. Network Summary Measures: Definitions and Descriptive Statistics
Each network statistic attempts to explore the underlying structure of the network along one of the four major dimensions: connectivity, assortativity, clustering and centrality. Within each dimension, various node level statistics can be employed to quantify individual positions in the network and describe the local neighborhood. For example, node degree (ND) and node strength (NS) are network statistics used to measure node connectivity. ND is used when dealing with a binary network, and is the fractional count of trading partners a country has relative to all possible trade links in the network. NS is used when dealing with weighted networks, and measures the intensity of these trade links.
Both statistics calculate the number of direct ties coming in and going out of a node and represent how connected a country is within a trade network. High degree positions are influential in the network, and at the same time, may be vulnerable to other actors' influence. These statistical measures are used in the empirical studies to offer evidence for or against increasing globalization. If the statistics increase in value, they show the globe is becoming smaller or more integrated over time.
The average nearest neighbor degree (ANND) and average nearest neighbor strength (ANNS) are the most common network statistics to test assortativity. They measure the number of trading partners and the intensity (volume of trade) of a given country's trading partners. For example, if country A has 20 trading partners and each of those 20 countries trades with 20 other countries, ANND/ANNS gives ND/NS statistics for each of country A's trading partners. These two statistics are commonly employed to assess whether certain groupings of countries tend to trade with well- or less-connected countries. For example, ANND/ANNS can be used to test whether a ‘rich club phenomenon’ has emerged in the WTN.
The binary clustering coefficient (BCC) and the core clustering coefficient (CCC) are statistics for clustering. The BCC is a ratio that counts the number of triangles that exist compared to the total number of triangles that are possible in the network. CCC measures the trade intensity of these triangles. These statistics offer a perspective on the multi-lateralism vs. bilateralism debate. Clearly, if the statistics increase over time, the WTN is strengthening multi-lateral ties, whereas if the statistic is decreasing, it is associated with a rise in bilateralism.
Lastly, the centrality dimension has probably received the most attention in the network analysis because of its explanatory power of describing the hierarchy that exists within the network. The betweenness (BET) and the random walk betweenness centrality (RWBC) measures are the most commonly employed statistic for the centrality dimension and are based on reach and flow mediation. Both statistics quantify the ability of the ego-node to influence other vertices in the network. The higher is the measure for a country, the higher is the degree of influence that country has on the WTN. Most often, this measure has been found to show a core-periphery hierarchy in the WTN, thus strengthening the position of world-systems perspective.
In addition to network statistics, homophily is an important feature in this study of social networks and helps to explain why we observe a particular type of network. The principle of homophily is predicated on the fact that people with similar characteristics will have a higher rate of contact between them than dissimilar people (Louch 2000; McPherson et al. 2001). One can scale this principle up to include, organizations, countries, regions, and so forth. In the present context, I am interested in whether homophily by region exists. That is, do regions delineated by geographical proximity and historical reference tend to trade more among themselves relative to ‘outsiders’ in other regions that do not share a similar degree of cultural and historical shared experience? While there are many different ways to delineate regions, the most basic source of homophily is space (McPherson et al. 2001), so it makes intuitive sense to group countries based on geographic proximity (refer back to Appendix for a country listing by region).
Transitivity is another main feature found within networks. Transitivity is a statistics that measures the degree of network integration. Balance theory predicts that people should adjust their relations until the network becomes stabilized around a pattern where all dyadic ties are largely transitive, that is triadic. This social phenomenon tends to be explained in terms of triadic relationships and by the adage ‘a friend of a friend is a friend’ (Krivitsky et al. 2009). Balance theory predicts that if ties exist between country A and country B and country B and country C, then country A and country C have a strong propensity to develop a tie. A triangle is defined to be any set f(i; j); (j; k); (k; i)g of three edges (Morris et al. 2008).
Descriptive Network Statistics: Connectivity, Centrality and Homophily
Mathematically, the node degree measures the probability of a randomly chosen vertex to have k-connections to other vertices and provides a summary of a node's overall activity. The number of incoming ties is called in-degree, expressed as the sum of incoming ties over the number of actors in the network minus 1. In-degree ties will equal out-degree ones, expressed as

Histograms of the node degree show that the distribution of trading partners is right-skewed, meaning that most countries in the network have a small number of trading partners but a smaller number of countries, referred to as ‘hubs’, have a comparatively larger number of trading partners (see Fig. 1).
Along the second dimension, centrality measures the quantity of walks that pass through the ego-node, that is betweenness. Betweenness (BET) is the tendency for an ego-node to reside on the shortest paths between third parties, that is, to serve as a bridge between two other nodes.
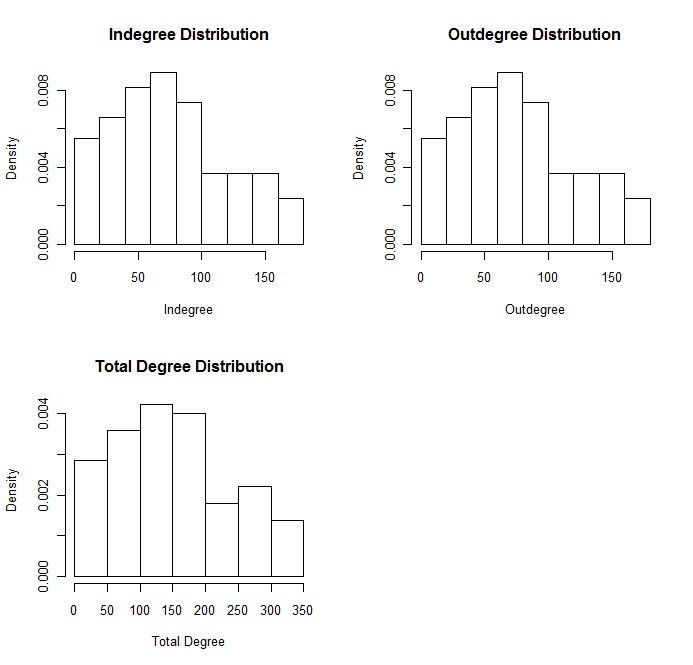
Fig. 1. Node degree distribution for the world trade network
Betweenness relies on the concept of geodesic distance, which is the shortest path between two nodes, i and j. Betweenness can be quantified and expressed as:
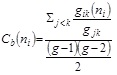
gjk is the number of j, k geodesics (the shortest path between j, k) and g¯ik (n¯i) is the number of j, k geodesics that include i. High betweenness positions are associated with the term ‘broker’. In the network literature, a ‘broker’ is an actor that mediates between third parties who are not directly tied. Both the node degree and betweenness measures are standardized and are compared to the theoretical maximum number of edges possible for that graph, values ranging from 0 to 1.
Another centrality measure that is less commonly explored in the world trade network is the eigenvalue centrality (EC). This measure quantifies the position of the actor in terms of the sum of the centralities of its neighbors, attenuated by a scaling constant (l). Eigenvector centrality can be expressed numerically as:
Actors with high eigenvector centrality are those with many central neighbors. This centrality measure is often overlooked by the previous articles on the WTN, which is bizarre considering this statistics is ideally suited to test core-periphery relations, a major focus point for the WTN analyses in the past.
Table 2 reports the statistics for a selective number of measures, including connectivity (ND) and centrality (BET, EC) by region. The findings reveal the most connected countries within regions, as well as compare the degree of influence across regions. For example, NAFTA and East Asian countries are the most connected and central/influential regions in the global economy. Despite the high connectivity and centrality scores for the United Kingdom, Germany and France, the EU consists of many small Eastern European countries not very well connected, thereby lowering overall average scores for the EU. SAA and the Arab league are the least connected and least central regions in the global economy.
Table 2
Connectivity and Centrality Measures by Region and Select Countries
|
Region |
ND |
BET |
EC |
|
1 |
2 |
3 |
4 |
|
NAFTA (n = 3) |
279.3 |
218.9 |
.107 |
|
USA |
346 |
439.39 |
.121 |
|
CAN |
284 |
186.2 |
.11 |
|
MEX |
208 |
31.2 |
.09 |
|
EU 2 (n = 40) |
210.3 |
103.8 |
.084 |
|
UKG |
344 |
522.9 |
.12 |
|
GFR |
340 |
376.9 |
.121 |
|
FRN |
338 |
304.3 |
.11 |
|
East Asia (n = 5) |
246 |
177.7 |
.094 |
|
JPN |
342 |
477.7 |
.12 |
|
China |
332 |
270.8 |
.121 |
|
ROK |
310 |
177.21 |
.11 |
|
ECE (n = 11) |
156.2 |
27.4 |
.079 |
|
RUS |
278 |
104 |
.11 |
|
UKR |
276 |
109 |
.12 |
|
BLR |
194 |
39.5 |
.082 |
|
1 |
2 |
3 |
4 |
|
ASEAN (n = 10) |
191.4 |
78.5 |
.079 |
|
THI |
304 |
233.7 |
.113 |
|
MAL |
298 |
170.4 |
.113 |
|
INS |
292 |
144.4 |
.112 |
|
SAA (n = 9) |
136.7 |
45.6 |
.058 |
|
IND |
314 |
222.7 |
.116 |
|
PAK |
262 |
107.6 |
.102 |
|
BNG |
196 |
57.68 |
.082 |
|
Arab League (n = 17) |
155.4 |
24.4 |
.068 |
|
SAU |
234 |
90.2 |
.093 |
|
ISR |
232 |
65.3 |
.095 |
|
UAE |
218 |
62.1 |
.09 |
|
Pacific Islands (n = 13) |
80 |
38.04 |
.033 |
|
AUL |
294 |
246.7 |
.11 |
|
AUS |
266 |
114.12 |
.106 |
|
NEW |
220 |
120.7 |
.09 |
|
Latin America (31) |
132.9 |
21.2 |
.059 |
|
BRA |
294 |
175.2 |
.11 |
|
ARG |
244 |
65.3 |
.101 |
|
RUM |
242 |
69.4 |
.1 |
|
African Union (50) |
106.3 |
11.2 |
.049 |
|
SAF |
280 |
131.2 |
.109 |
|
EGY |
228 |
49.5 |
.096 |
Within East Asia, China has only 10 fewer trading partners than Japan (i.e. connectivity), yet its BET centrality score is almost half as big as Japan's. This distinction between connectivity and centrality is a key feature of network analysis. It reveals that although China is increasing the number of its trading parners and becoming better connected with the global economy, its actual influence in the network in terms of trade remains limited relative to Japan. Japan, along with the UK, and the USA have the highest BET centrality score, representing the brokers in the network; China, on the other hand, is plotted much lower than any of these three countries (see Fig. 2).
To gain a better understanding on whether homophily by region is present in the WTN, I present the mixing matrix for each region (Table 3). The mixing matrix presents the count of trade relationships cross-tabulated by the region of the two countries involved. If a strong presence of homophily is present, then there would be large values along the diagonal relative to off-diagonal values. Based on the fact that the diagonal values in the matrix do not tend to be higher than the off-diagonal values, countries do not appear to be overwhelmingly trading within their particular region; homophily by region does not appear to be a major factor.
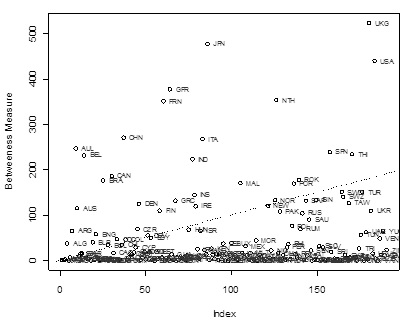
Fig. 2. Centrality score by country
Table 3
Mixing matrix by region
|
1 |
2 |
3 |
4 |
5 |
6 |
7 |
8 |
9 |
10 |
11 | |
|
1 |
3 |
104 |
3 |
12 |
21 |
23 |
18 |
40 |
19 |
81 |
92 |
|
2 |
104 |
590 |
37 |
144 |
302 |
250 |
168 |
388 |
141 |
599 |
893 |
|
3 |
3 |
37 |
NA |
5 |
11 |
10 |
7 |
16 |
7 |
27 |
43 |
|
4 |
12 |
144 |
5 |
7 |
38 |
37 |
25 |
52 |
23 |
99 |
123 |
|
5 |
21 |
302 |
11 |
38 |
47 |
48 |
43 |
71 |
27 |
98 |
106 |
|
6 |
23 |
250 |
10 |
37 |
48 |
40 |
51 |
93 |
43 |
128 |
194 |
|
7 |
18 |
168 |
7 |
25 |
43 |
51 |
16 |
62 |
29 |
62 |
118 |
|
8 |
40 |
388 |
16 |
52 |
71 |
93 |
62 |
83 |
44 |
142 |
247 |
|
9 |
19 |
141 |
7 |
23 |
27 |
43 |
29 |
44 |
13 |
80 |
81 |
|
10 |
81 |
599 |
27 |
99 |
98 |
128 |
62 |
142 |
80 |
243 |
259 |
|
11 |
92 |
893 |
43 |
123 |
106 |
194 |
118 |
247 |
81 |
259 |
251 |
There are two caveats to this interpretation. First, marginal totals can be misleading and do not statistically test for the presence of homophily (this will be carried out in the modeling section below). The trade network is also very complex and strict interpretations of homophily are not always straight forward. For example, the largest value in the matrix is between Europe (region 2) and Africa (region 11). Due to the colonization era, African and European countries still maintain a strong, client-like relationship in many cases. Second, there are likely some misleading results due to the way countries are grouped. While there is no ‘right’ way to group countries into regions, defining China (region 4) as its own region has some drawbacks in certain cases, since its value along the diagonal is 0, and the data only cover international trade. Therefore, it is not possible to see China's intra-trade relationships and how it compares to other countries' international trade within a particular region.
The number of triangles found in the network area is a proxy for measuring the transitivity. Of the 7,177 ties in the network, the number of triangles is surprisingly large – 157,645. This number is far larger than what would be expected by chance and offers initial evidence that the trade network has a high degree of transitivity. This is significant because it reveals the dyadic trade dependencies among countries supporting the use of a latent space modeling approach.
5. Latent Space and Latent Position Model: Is Geography Dead?
Latent space models have replaced block-modeling as the primary approach to study issues of propinquity, the tendency of spatially proximate vertices to be tied. In other words, latent space models are used to determine the role of geography in the international trade context, and can help examine whether the trade network is globalizing or regionalizing. If proponents of globalization who suggest ‘geography is dead’ are correct in their assertion, then the results of the latent space model will confirm that distance does not play a significant role in influencing the probability that a trade tie is established between country i and country j.
In order to test the role of geography in determining the probability two countries (i, j) form a trade relationship, I specify several latent space models. Based on the presence of homophily indicated by the descriptive statistics, there is evidence that propinquity – the probability of a link between two actors is a function of the distance between them in an unobserved latent space – exists in the trade network.
The latent position model assumes a conditional independence approach to modeling. Let {zi} be the positions of the actors in the social space Rk and {xi, j} denote the observed characteristics that are dyad-specific. That is the presence or absence of a trade tie between two countries is independent of all other ties in the system, given the unobserved positions in social space of the two individuals:
P(Y|Z, X, θ) = ÕP(yi, j | zi, zj, xi, θ),
where X and xi and xi, j are observed characteristics that are pair-specific and vector-valued and θ and Z are parameters and positions to be estimated (Hoff et al. 2002). I use logistic regression to parameterize equation (3).
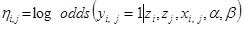
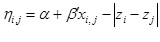
where the log odds ratio for two actors j and k, equidistant from i, is ![]() . I estimate hi, j using the log-likelihood of a conditional independence model, expressed as
. I estimate hi, j using the log-likelihood of a conditional independence model, expressed as
where h is a function of parameters and unknown positions. As such, I use maximum-likelihood to estimate h. Model degeneracy is a serious problem that frequently occurs when dealing with networks. If a model is degenerate then the terms in the model are grossly unsuitable at describing the underlying processes that form the observed network. That is, even under the maximum likelihood coefficients in the model, the observed network is so unlikely to occur that the model cannot even be properly estimated (Goodreau et al. 2008). To check for issues of degeneracy, I carry out an MCMC estimation procedure for each model that I estimate. The results show that the model statistics do not diverge from the mean, meaning that the models are not degenerate and the maximum likelihood estimates are reliable.
I specify several simple latent space models to test the role of distance and region-based homophily. Table 4 reports the coefficients generated from the latent space models. Model 1 only examines the role of distance in establishing a trade partner. The coefficient on EDGES is highly significant and positive, indicating that larger distances increase the likelihood of two countries establishing a tie. This finding is bizarre and at odds with predictions made by gravity models that predict trade decreases as a function of distance. In Models 2 and 3, I give additional measures to control for underlying structures within the network that may affect whether a trade tie is established.
Table 4
Latent space models (d=2)
|
Model 1 |
Model 2 |
Model 3 |
Model 4 | |
|
Edges |
2.56*** |
–5.73*** |
–6.21*** |
–6.13*** |
|
Latentcov (homoregion) |
|
26.25*** |
27.20*** |
27.81*** |
|
Triangle Nodecov.GDP |
|
|
1.84*** |
2.02*** 1.42*** |
A good model is the one that accounts for a country's tendency for assortative mixing, which is based on the notion of homophily (Goodreau et al. 2008). In the present context, I want to account for assortative mixing that may occur for countries that belong to a particular region. If assortative mixing is present, then countries within the same region have a greater probability of forming a tie relative to countries in other regions.
Model 2 introduces Homoregion, a covariate that accounts for homophily. In this model, I find the sign of the EDGES coefficient switches from negative to positive, confirming the conventional relationship between trade and distance. In other words, the likelihood of two countries forming a tie decreases as distance between countries in latent space increases. The coefficient on Homoregion is very large and statistically significant. This finding indicates that countries classified into the same regional grouping will be more likely to form a trade tie within their own region than with countries from other regional groupings, in support of the regionalization thesis. Model 3 adds Triangle to take into account the transitive nature of the network. The significant, positive coefficient for Triangle confirms that if two countries i, j, have a mutual trading partner, m, then the likelihood that countries i, j begin to trade increases.
In addition to controlling for network statistics, Model 4 adds real per capita GDP, Nodecov.GDP as an additional covariate to control for the effect of wealth on countries forming a tie. The positive, statistically significant coefficient produced by the wealth covariate reveals the hierarchical structure of the network, meaning that rich countries tend to trade disproportionately among themselves.
6. Conclusion
The findings presented in this paper suggest that regionalization is a particularly important strategy pursued by countries in the global economy. The integration of regional blocs, along with the proliferation of regional trade agreements (RTAs) promote regionalization and have emerged as individual countries attempt to mitigate the new economic and security vulnerabilities (unregulated capital flows, human and drug trafficking, transnational terrorist networks, disease, etc.) brought about by globalizing forces that undermine individual states' territorial sovereignty. The process of regionalization signals that ‘geography is destiny’ (Dieter 2007: 11), as opposed to ‘geography is dead’.
The results of the descriptive analyses in this report agree with other previous work. The WTN network has a high density, the node degree has a high right-skew, trade partners of well-connected countries are less interconnected relative to those of poorly connected ones, and countries holding many trade partners are on average connected with countries holding relatively few countries. The latent space model tests directly the role of space in determining the likelihood of whether or not a tie will be established. When controlling for regional homophily and other covariates, the Euclidean distance – calculated in social space – is returned negative, significant, and large in magnitude. This result supports findings in the gravitas literature on trade and reaffirms that the probability that trade ties are established decreases as distance increases. Lastly, the latent space models add an additional dimension of analysis of the WTN by controlling for network dependencies, and reveals that region-based homophily – the proxy for regionalization – has a large and significant influence on trade outcomes, even more so than a country's wealth.
Despite the complicated nature of the WTN, pertinent topological properties of the global trade system are extracted through modeling the system as a network, and are used to show the significance of geography in influencing trade outcomes. Understanding the structure of the global trade network has implications for research across numerous social science disciplines trying to examine the effects of geography on economic integration and internationalization. Future areas of research can extend the latent space model applied in this paper to examine the evolutionary role of geography over time. Although evidence reported in this paper suggests that geography maintains a crucial role in the trade network, it is indeterminate whether geography's impact on trade ties is increasing or decreasing over time.
NOTE
1 Node degree is discussed in greater detail in Section 4.
References
Aggarwal, V. K., and Koo, M. G.
2005. Beyond Network Power? The Dynamics of Formal Economic Integration in Northeast Asia. The Pacific Review 18: 189–216.
Bhagwati, J., Greenaway, D., and Panagariya, A.
1999. Trading Preferentially: Theory and Policy. The Economic Journal 108: 1128–1148.
Bhattacharya, K., Mukherjee, G., Saramaki, J., Kaski, K., and Manna, S.
2008. The International Trade Network: Weighted Network Analysis and Modeling. Journal of Statistical Mechanics: Theory and Experiment 2008(02): P02002. Doi:10.1088/1742-5468/2008/02/p02002.
Clark, R.
2008. Dependency, Network Integration, and Development. Sociological Perspectives 51: 629–648.
2010. World-System Mobility and Economic Growth, 1980–2000. Social Forces 88: 1123–1151.
Dieter, H.
2007. An Introduction. In Dieter, H. (ed.), The Evolution of Regionalism in Asia: Economic and Security Issues (pp. 3–10). London: Routledge.
Fagiolo, G., Reyes, J., and Schiavo, S.
2009. World-Trade Web: Topological Properties, Dynamics, and Evolution. Physical Review E Statistical 79: 1–36.
Friedmann, J.
1995. Where We Stand: A Decade of World City Research. In Knox, P., and Taylor, P. (eds.), World Cities in a World-System (pp. 21–47). Cambridge: Cambridge University Press.
Garlaschelli, D., and Loffredo, M.
2005. Structure and Evolution of the World Trade Network. Physica A: Statistical Mechanics and its Applications 355: 138–144.
Garlaschelli, D., Di Matteo, T., Aste, T., Caldarelli, G., and Loffredo, M.
2007. Interplay between Topology and Dynamics in the World Trade Web. The European Physical Journal B 57: 159–164.
Goodreau, S. M., Handcock, M. S., Hunter, D. R., Butts, C. T., and Morris, M.
2008. A Statnet Tutorial. Journal of Statistical Software 24: 1–27.
Harary, F.
1959. A Graph Theoretic Method for the Complete Reduction of a Matrix with a View Toward Finding its Eigenvalues. Journal of Math Physics 68: 104–111.
Harary, F., Norman, R., and Cartwright, D.
1965. Structural Models: An Introduction to the Theory of Directed Graphs. New York: Wiley.
He, J., and Deem, M.
2010. Structure and Response in the World Trade Network. Physical Review Letters 105: 1–4.
Hoff, P. D., Raftery, A. E., and Handcock, M. S.
2002. Latent Space Approaches to Social Network Analysis. Journal of the American Statistical Association 9: 1090–1098.
Hunter, D. R., and Handcock, M. S.
2005. Inference in Curved Exponential Family Models for Networks. Journal of Computational and Graphical Statistics 15: 565–583.
Kali, R., and Reyes, J.
2007. The Architecture of Globalization: A Network Approach to International Economic Integration. Journal of International Business Studies 38: 595–620.
Kastelle, T., Steen, J., and Liesch, P.
2006. Measuring Globalization: An Evolutionary Economic Approach to Tracking the Evolution of International Trade. DRUID Summer Conference (рр. 1–41). Copenhagen.
Kim, S., and Shin, E.-H.
2002. A Longitudinal Analysis of Globalization and Regionalization in International Trade: A Social Network Approach. Social Forces 81: 445–468.
Krivitsky, P. N., Handcock, M. S., Raftery, A. E., and Hoff, P. D.
2009. Representing Degree Distributions Clustering and Homophily in Social Networks with Latent Cluster Random Effects Models. Social Networks 31: 204–213.
Krugman, P.
1993. Geography and Trade. Cambridge, MA: Cambridge University Press.
Louch, H.
2000. Personal Network Integration: Transitivity and Homophily in Strong-tie Relations. Social Networks 22: 45–64.
Massey, D.
1984. Spatial Divisions of Labor: Social Structures and the Geography of Production. New York: Methuen.
1999. Imagining Globalization: Power-Geometries of Time-Space. In Brah, A., Hickman, M., and Mac an Ghaill, M. (eds.), Global Futures: Migration Environment and Globalization (pp. 27–44). Basingstoke: Macmillan.
McPherson, M., Smith-Lovin, L., and Cook, J. M.
2001. Birds of a Feather: Homophily in Social Networks. Annual Review of Sociology 27: 415–444.
Moore, T.
2007. China's Rise in Asia: Regional Cooperation and Grand Strategy. In Dieter, H. (ed.), Evolution of Regionalism in Asia: Economic and Security Issues (pp. 34–56). London: Routledge.
Morgan, K.
2004. The Exaggerated Death of Geography: Learning Proximity and Territorial Innovation systems. Journal of Economic Geography 4: 3–21.
Morris, M., Handcock, M. S., and Hunter, D. R.
2008. Specification of Exponential-Family Random Graph Models: Terms and Computational Aspects. Journal of Statistical Software 24: 1548–7660.
Ohmae, K.
1990. The Borderless World: Power and Strategy in the Interlinked Economy. New York: Harper.
1995. The Evolving Global Economy: Making Sense of the New World Order. Boston, MA: Harvard Business Review Press.
O'Brien, R.
1992. Global Financial Integration: The End of Geography. New York: Foreign Relations Press.
Reyes, J., Schiavo, S., and Fagiolo, G.
2007. Using Complex Network Analysis to Assess the Evolution of International Economic Integration: The Cases of East Asia and Latin America. LEM Working Paper Series.
2010. Using Complex Networks Analysis to Assess the Evolution of International Economic Integration: The Cases of East Asia and Latin America. The Journal of International Trade & Economic Development 19: 215–239.
Schiavo, S., Reyes, J., and Fagiolo, G.
2010. International Trade and Financial Integration: A Weighted Network Analysis. Quantitative Finance 10: 389–399.
Serrano, M.
2008. Rich-club vs Rich-Multipolarization Phenomena in Weighted Networks. Physical Review E 78: 026101.
Serrano, M. A., and Boguna, M.
2003. Topology of the World Trade Web. Physical Review E 68: 015101.
Shortreed, S., Handcock, M. S., and Hoff, P. D.
2006. Positional Estimation within the Latent Space Model for Networks. Methodology 2: 24–33.
Squartini, T., Fagiolo, G., and Garlaschelli, D.
2011. Rewiring World Trade. Part I. A Binary Network Analysis. LEM Working Paper Series.
Staples, A.
2007. Responses to Regionalism: Corporate Strategy in East Asia. In Dieter, H. (ed.), Evolution of Regionalism in Asia: Economic and Security Issues (pp. 99–122). London: Routledge.
Toffler, A.
1970. Future Shock. Bantam Books.
Warwick, M.
2005. Geographies of Globalization. London – New York: Routledge.
Yeung, H.
1998. Capital State and Space: Contesting the Borderless World. Transactions of the Institute of Brittish Geographers 23: 291–309.
Appendix
190 countries are placed into 11 regions. These regions are based on present-day trading blocs and/or geographical location. Several regions combine two or more economic trading blocks that span a certain geographic region. For example, the EU, EFTA and Central European FTA member countries are all categorized as one European region based on their geographical proximity. Similarly, UNASUL, Caribbean Community and the Central American Integration System member countries are all categorized as Latin America.
Regional Groupings
|
NAFTA (Region 1) CAN MEX USA Europe (Region 2) ALG AND ANG ARG ARM AUL AUS AZE BAH BAR BEL BEN BFO BHM BHU BLR BLZ BNG BOL BOS BOT BRA BRU BUI BUL CAM |
CAN CAO CAP CDI CEN CHA CHL CHN COL COM CON COS CRO CUB East Asia (Region 3) (Also Region 4) JPN MON PRK ROK TAW CHN Eurasian Economic Community (Region 5) ARM AZE BLR GRG KYR KZK |
RUS TAJ TKM UKR UZB ASEAN (Region 6) BRU CAM DRV INS LAO MAL DRV MYA PHI SIN THI South Asia Association (Region 7) AFG BHU BNG IND MAD NEP PAK SOL SRI |
|
Arab League (Region 8) BAH EQG IRN IRQ ISR JOR KUW LEB MOR OMA PAL QAT SAU SUD SYR UAE YEM Pacific Islands (Region 9) AAB AUL AUS DMA FJI FSM KBI NAU NEW PNG TON TUV VAN Latin America (Region 10) ARG BAR BHM BLZ BOL BRA BRA CHL |
COL COS CUB DOM ECU GRN GUA GUI GUY HAI HON JAM MSI NIC PAN RUM SAL SKN SLU SUR SVG TRI URU VEN African Union (Region 11) ANG BEN BFO BOT BUI CAO CAP CDI CEN CHA COM CON DJI DRC EGY ERI |
ETH GAB GAM GHA GNB KEN LBR LES LIB LIE MAG MAS MAW MLI MZM NAM NIG NIR PAR PER RWA SAF SEN SEY SIE SOM STP SWA TAZ TOG TUN UGA ZAM ZIM |
Размещено в разделах