Bumpy Road to Climate Neutrality: Why the 1.5 °C Threshold is Close and Why the Temperature Overshoot will be Long
скачать Авторы:
- Klimenko, Vladimir V. - подписаться на статьи автора
- Tereshin, Alexey G. - подписаться на статьи автора
- Mikushina, Olga V. - подписаться на статьи автора
Журнал: Journal of Globalization Studies. Volume 16, Number 1 / May 2025 - подписаться на статьи журнала
DOI: https://doi.org/10.30884/jogs/2025.01.01
Vladimir V. Klimenko, National Research University ‘MPEI’; National Technological Research University ‘MISIS’; Institute of Geography of RAS; Energy Research Institute of RAS
Alexei G. Tereshin,National Research University ‘MPEI’; National Technological Research University ‘MISIS’; Institute of Geography of RAS
Olga V. Mikushina, Energy Research Institute of RAS
The possible consequences of the decisions taken at the recent Conferences of the Parties to the UN Framework Convention on Climate Change COP26 (Glasgow 2021) and COP28 (Dubai 2023), for the world energy and future climate change are examined.
A set of scenarios of anthropogenic impacts on the global climate system is proposed, including the full implementation of the Glasgow decisions on decarbonisation of the world economy, reduction of methane emissions and reforestation, as well as alternative scenarios for world energy development based on low options for changes in world population, in order to prevent dangerous global climate change. The global carbon cycle and climate models developed at MPEI have been used to simulate changes in the chemical composition and thermal radiation balance of the Earth's atmosphere, as well as the global average air temperature for each of the scenarios.
It is shown that only the full implementation of the full range of measures proposed in Glasgow to reduce the anthropogenic impact on the planet's climate system, while maintaining the current growth rates in energy consumption and world population, will be able to keep warming below 1.5° C with reference to pre-industrial levels, but there are serious doubts about the practical implementation of the proposed program of decarbonisation of the world economy. At the same time, our findings suggest that the development of natural demographic processes can restrain growth and ensure a decrease in the atmospheric carbon dioxide concentrations even before the end of this century. In this case, the increase in global average temperature can be limited to a marginally safe level of 1.8 degrees above the pre-industrial period, without a large-scale restructuring of the world's energy sector. However, it is virtually certain that the 1.5 °C threshold will be exceeded within the next decade, and that the period of 1.5 °C temperature overshoot will last for more than a century. Already by the end of this century, global temperatures will have to be brought back down by explicitly removing carbon dioxide fr om the atmosphere: an immense task that will require a build-up of a negative-emissions economy.
Keywords: energy, climate, atmosphere, demography, forest management, methane and carbon dioxide emissions, models, scenarios.
Introduction
The year 2023 became the hottest one in the history of instrumental observations and ended with a striking record for the global mean temperature, exceeding (according to CRU) the pre-industrial (1850–1900) level by 1.46 °C. At the same time, the previous record of 2016 was exceeded at once by 0.17 °C, a huge margin at the planetary scale, which is an unprecedented event in the entire era of instrumental observations and brings about a serious alarm to the global scientific community (Schmidt 2024). In 2024, the streak of records continued and a unique 13-month series (fr om June 2023 to June 2024) of monthly maximums was recorded. Finally, against expectations, 2024 became even hotter than 2023 with temperatures 1.55°C above the pre-industrial level, thereby crossing the first critical threshold outlined in the Paris Agreement. And although this is only one year's temperature, the event that has occurred is an important indication and a warning to the global community that the dangerous warming level is very close. The climatically meaningful decade-averaged global temperature anomaly (over the 2015–2024 period) has reached 1.26°C, and thus the world is within one step of the 1.5 °C threshold, which the global community definitely considers as an extremely undesirable event (King et al. 2023). Should the warming rate of about 0.2 °C per decade experienced over the past 30 years be maintained, the critical threshold will be crossed as early as the mid-2030s. In the current situation, the best and still reasonable scenario is a temporary overshoot of the 1.5 °C threshold, with a peak in warming followed by a decline in temperature as a result of the consistent implementation of the initiatives of the Glasgow (2021) (Klimenko et al. 2022a; Klimenko et al. 2023a) and Dubai (2023) (Klimenko et al. 2024a; Klimenko et al. 2024b; Klimenko et al. 2024c) summits or the implementation of low demographic scenarios (Klimenko et al. 2022a; Akaev, Davydova 2023). The overshoot is a significant threat to the stability of the global climate system, and the world community is aiming to minimize the residence time in the elevated temperature zone.
Over the past thirty years, the global community has made considerable efforts to control dangerous global warming by reducing the greenhouse gas (GHG) emissions, with the aim of achieving the so-called climate neutrality, when GHG emissions are balanced by their sink in natural or anthropogenic reservoirs (Fragkos et al. 2021; Das et al. 2023).
Since the United Nations Framework Convention on Climate Change (UNFCCC) was signed in Rio de Janeiro in 1992, participating countries have met almost every year at conferences to discuss progress in implementing the Convention and developing new climate protection tools. The results of four such meetings, where the most important decisions were taken, are presented in Table 1.
Table 1
Objectives and proposed tools of the four key Conferences of the UNFCCC Parties
|
Conferences |
Goal |
Proposed tools |
|
Kyoto (1997) |
Reducing the average global temperature increase rate |
Commitments by the Group of 38 countries to control the greenhouse gas emissions in 2008–2012. The first economic mechanisms for international cooperation in the field of reducing greenhouse gas emissions control |
|
Paris (2015) |
Preventing the global average temperature fr om rising more than 2 °С above pre-industrial levels |
Acceptance by more than 190 countries of voluntary commitments to control greenhouse gas emissions after 2020 |
|
Glasgow (2021) |
Limiting the global warming to 1,5 °С above pre-industrial levels |
1. Commitments by most countries, including all major greenhouse gas emitters, to attain climate neutrality by 2050–2070. 2. Commitments by a group of 109 countries (today already 160) to cut down the anthropogenic methane emissions by 30 % by 2030. 3. Commitments by 140 countries to stop deforestation by 2030 and then start reforestation |
|
Dubai (2023) |
Development of top-priority measures to control the greenhouse gas emissions |
By 2030: 1. Tripling of installed renewable energy capacity. 2. Halving energy consumption per unit of gross national product. 3. Fourfold reduction in methane emission fr om fossil fuels combustion, |
An analysis of Table 1 has revealed the increasing vigor of the measures taken by the world community to respond appropriately to dangerous climate change, driven by the continuing trends of global warming, a deeper understanding of the nature and danger of the ongoing processes, and the low rate of decarbonisation of the global economy.
In a number of our recent works, we have studied the consequences for the global climate system of different scenarios for reducing anthropogenic impacts on the Earth's atmosphere under the Paris Agreement (Klimenko et al. 2016a; Klimenko et al. 2016b) and the Glasgow Pact (Klimenko et al. 2022a; Klimenko et al. 2023a) as well as the capabilities of the world's leading economies (such as the USA, EU, Canada, Australia, Japan, Norway) (Klimenko et al. 2024b; Klimenko et al. 2024d), the largest developing countries (such as China, India, Indonesia, Brazil, Iran, Saudi Arabia) (Klimenko et al. 2024c; Klimenko et al. 2024d), and Russia (Klimenko et al. 2023b; Klimenko et al. 2024a) to solve the emerging problems in the field of climate control, including achieving carbon neutrality of national economies by 2050–2060. The obtained results suggest that, despite the great potential for reducing greenhouse gas emissions in various industries and the great efforts being made, all these countries face considerable difficulties in achieving these goals. At the same time, differences in the structure of the energy industry and in the standards of living in these countries determine the specifics of their paths to carbon neutrality.
The purpose of this work is to analyze the results of previous studies and to assess the potential consequences for civilization of global climate changes manifested at different scales.
1. Scenarios of Anthropogenic Impacts on the Climate System
1.1. ‘Glasgow’ and ‘Paris’
To construct a range of potential scenarios for carbon dioxide emissions in the sectors of the global economy covered by the Glasgow Conference agreements, all the countries of the world have been divided into several groups according to their level of economic development and, to a large extent related to this, the level of ambition of their national long-term programs for reducing the anthropogenic impact on the climate.
The first ‘2050’ group includes OECD (Organization for Economic Cooperation and Development) and EU countries, whose voluntary commitments envisage the attainment of carbon neutrality not later than by 2050. The second (‘2060’) and third (‘2070’) groups are the world's largest developing or emerging economies, whose national programs call for zero net greenhouse gas emissions by 2060 (Russia, China, Brazil, Argentina, Iran, and Turkey) and 2070 (India), respectively. The poorest countries in Asia and Africa, which do not currently have their own programs to considerably cut down the greenhouse gas emissions, are included in the fourth ‘2080’ group, which is expected to achieve carbon neutrality by 2080 with financial and technological support from the world's leading economies.
The resulting emission estimates are presented in Figure 1, together with scenarios from (Klimenko et al. 2016a, 2016b), which were previously prepared based on the results of the Paris Conference of the Parties to the UNFCCC (2015). Here, the carbon coefficient is the ratio of carbon dioxide emissions (in carbon units) to commercial energy consumption (in coal equivalent units).
Implementation of the Paris Agreement will reduce CO2 emissions by 5 % by 2050, 10 % by 2070, and 30 % by 2100 compared to the historical scenario. As shown in (Klimenko et al. 2016a, 2016b), these emission amounts will not lim it the global average temperature increase to 2 °C compared to the pre-industrial period.
Much tighter limits on carbon emissions, as proposed by the decisions of the UNFCCC Conference of the Parties in Glasgow (2021), should offer much larger emission reductions (compared to the historical scenario [Klimenko et al. 2016a, 2016b]) – by almost 20 % by 2030, more than twice by 2050, and almost four times by 2100.
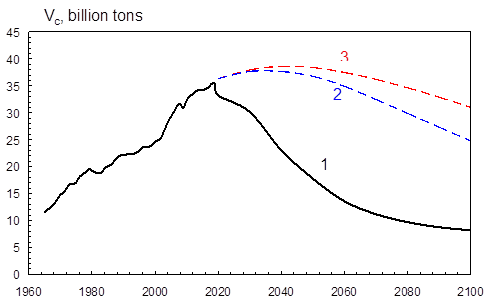
Fig. 1. Global carbon dioxide emissions
Vс according to the Glasgow scenario (1)
(Klimenko et al. 2022a; Klimenko et al. 2023a) as compared to the reference
(2) and historical (3) versions of the Paris scenario from (Klimenko et al. 2016a, 2016b)
Among the most important results of the Glasgow meeting was the initiative to reduce anthropogenic methane emissions by 30 % by 2030. Unlike carbon dioxide, whose main anthropogenic source is the combustion of organic fuels, more than half of methane enters the atmosphere from agricultural sources, while the energy industry and waste management account for only 30 % and 20 %, respectively. As a result, the most densely populated countries – India and China – and the poorest countries in Asia and Africa are responsible for more than half of the world's anthropogenic emissions.
And finally, for the first time at the international level, the Glasgow
conference adopted commitments to conserve and restore the planet's forests – the
most important controlled carbon sink. The implementation of this decision should
stop the centuries-long loss of the Earth's forest cover and launch a subsequent
reforestation of the planet. This scenario is very close to the GEPL’97 biotic option
for reducing the anthropogenic pressure on the carbon balance, proposed by the authors
back in 1999 (Klimenko et al.
1999), which assumes that the area of the planet's forests should be restored to
pre-industrial (before 1800) levels. An alternative to this Glasgow scenario for
forests is the FAOSTAT option from our recent
work (Klimenko
et al. 2020), according to which
the trends of recent decades in global forest use are maintained.
The changes proclaimed by the Glasgow Pact are unprecedented in history, and therefore a reasonable question arises: whether such large-scale transformations in the global economy are theoretically and technically feasible, in such a short period of time. This question should be addressed first and foremost, to the key sector of the global economy, the energy industry, which is responsible for 90 per cent of carbon emissions and has been involved in large-scale reforms in recent decades, known as the ‘global energy transition’ (Klimenko et al. 2022c).
An analysis of numerous publications from leading scientific institutions in this field (Falk et al. 2018; IEA, 2020; Makarov et al. 2020; Vatalis et al. 2022; Olabi and Abdelkareem 2022) shows that the technical potential for reducing worldwide greenhouse gas emissions is more than 7 Gt Ceq/year and can be implemented through a wide range of process and institutional instruments, of which about half is related to the energy and transport sectors, with the renewable energy industry contributing about a quarter of the emission reduction.
1.2. Alternative Demographic Scenarios
Implementing the Glasgow path will require extraordinary efforts in all major sectors of the global economy – energy, transport, agriculture, and forestry – and can hardly be achievable today. We have repeatedly expressed our doubts that the global community has the real capacity to keep the increase in the global average temperature within the specified limits. Indeed, this problem seems almost unsolvable, but only if the world population continues to grow without any limitations until the end of the century.
This is exactly how the demographic picture of the world looks today, as demonstrated by the United Nations Population Division (hereafter referred to as the UN) (Figure 2), according to which the world population will stabilize at a level of 9–11 billion people by the end of the century, i.e. about a quarter higher than today. As a result, human impact on the environment is also predicted to increase in the coming decades (unless additional restrictive measures are taken). It is quite obvious that the scale of this impact depends critically on which of the scenarios presented in Figure 2 is to be activated. It so happens that the UN's ideas have dominated in the field of population forecasting over the last half century. Indeed, almost all the forecasts of energy, industry, agriculture, forestry, and transport that we know employ only one long-term demographic forecast1: the UN median projection, which has been published regularly every two years since the 1980s, and irregularly since 1951. Such unwavering faith in a single source of projections is found in no other area of modern knowledge, and is not least due to the fact that the UN still seems to be doing a good job of fulfilling its mission. For example, the world population of 7.79 billion in 2020 agrees almost exactly with the 1980 forecast (World Population… 1981), but it differs considerably from the 1973 forecast of 8.42 billion and even from the 1990 forecast of 8.09 billion (Buettner 2020). Thus, all we know now is that the UN is able to produce satisfactory forecasts with an accuracy of 5 % for horizons of up to 40 years (Ibid.), but nothing can be said today about the quality of more distant forecasts, since horizons of more than 50 years came into circulation only in 1994, and horizons of more than 80 years only in 2010. However, now, given the events of recent decades, it no longer seems unlikely that fertility2 in many countries of the world will sharply drop to levels well below simple population replacement, and it is therefore worth taking a closer look at those demographic projections that study this possibility with adequate care and detail.
Several contemporary researchers have persistently drawn attention to the shortcomings of the UN forecasts (World Population 2014; KC and Lutz 2017; Vollset et al. 2020; Akaev and Sadovnichii 2010). The main drawback of these forecasts seems to be the very arbitrary assumption of the ultimate convergence of fertility to a single value of 1.75 for all countries in the world that have crossed in their development the critical fertility threshold of 2.1, which corresponds to simple reproduction of the population. However, in the last quarter of the century, dozens of countries have appeared wh ere the fertility has dropped well below 1.75 and has remained at this extremely low level for decades (Greece, Italy, Poland, Thailand, Taiwan, South Korea, etc.). It also turns out that the final fertility rates correlate well with two key social factors: years of educational attainment (0 to 18 years) and the availability of modern contraceptives (0 to 100 %) to women of reproductive age. Taking these new facts into account allows us to construct more reliable demographic models that predict that the world population will peak within just a few decades, that is, within the lifetime of one or two generations, followed by a pronounced depopulation by the end of the century. According to recent publications, the Earth's population is likely to be in the range of 6–9 billion people by the end of this century (Figure 2), which will undoubtedly affect the impact of our civilization on the environment. In this system of views, the UN median forecast is not the golden mean, as many would like to think, but the upper envelope of an entire family of alternative scenarios (Figure 2). This paper uses two such scenarios (Vollset et al. 2020) together with the conventional most recent UN median scenario (World Population 2024).
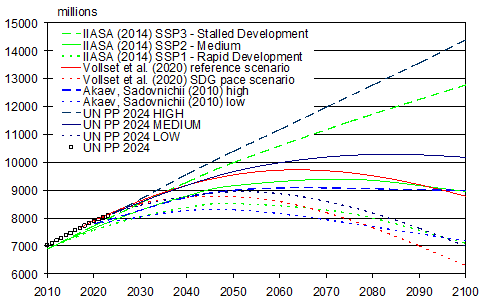
Fig. 2. Alternative scenarios for
the world population with depopulation
(World Population 2014; Vollset et al.
2020; Akaev and Sadovnichii 2010;
World Population 2024)
The above-described demographic processes will first affect global energy consumption. As already shown in (Klimenko and Tereshin 2010), the post-industrial development has stabilized the per capita energy consumption at a level that is essentially determined by natural and geographical conditions, and which, on a global average, amounts to about 3 tce3/cap*year, which is hardly different from the current level. This means that the dynamics of future energy consumption will be almost entirely determined by demographic factors.
The presented predictions were obtained for two demographic scenarios from (Vollset et al. 2020), namely, the high ‘reference’ scenario and the lower ‘Sustainable Development Goal (SDG)’ pace scenario as the most justified from a medical standpoint and located at the upper and lower ends of the range of depopulation scenarios (Figure 2).
In this case, depopulation will reduce global energy consumption (Figure 3), which, by the end of the century could be as low as 20–40 per cent down of the reference scenario level (around 30 billion tce by 2100). Moreover, according to the extreme SDG pace scenario, the gross energy consumption will stop growing by mid-century, and it will be even lower than current levels by the end of the century.
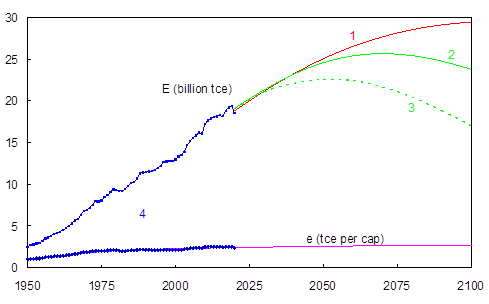
Fig.
3. Gross (Е) and specific (е) commercial energy consumption
for WPP2024 medium (World Population 2024) (1), reference (2),
and SDG pace (3) (Vollset et al. 2020) demographic scenarios together
with historical data from UN/BP (4)
Lower energy consumption inevitably yields lower emissions of the main greenhouse gas – carbon dioxide. Two main pathways for the development of the global energy industry in the current century are examined in this paper:
1) ‘const CC rate’ – it is assumed that the decarbonisation rate of energy consumption stipulated by the Paris Agreement (approximately 0.8 % per year) (Klimenko et al. 2016a; Klimenko et al. 2016b) will not change;
2) ‘const nonCO2 rate’ – it is assumed that the deployment rate of zero-carbon energy sources (hydroelectric power plants, nuclear power plants, renewable energy sources) necessary to meet the conditions of the Paris Agreement, yielding the annual energy production from them of up to 20 billion tce by 2100, will not change (Klimenko et al. 2016a, 2016b).
Table 2
Combinations of demographic and energy scenarios
|
No. |
Demographic scenarios |
Energy scenarios from |
|
1 |
Reference |
‘const CC rate’ |
|
2 |
Reference |
‘const nonCO2 rate’ |
|
3 |
SDG pace |
‘const CC rate’ |
|
4 |
SDG pace |
‘const nonCO2 rate’ |
As a result, the global industrial carbon dioxide emissions will fall considerably after 2030, by 15–40 per cent compared to the Paris reference scenario from (Klimenko et al. 2016a, 2016b), and even by a factor of 10 in the most extreme version by the end of the century (Figure 4).
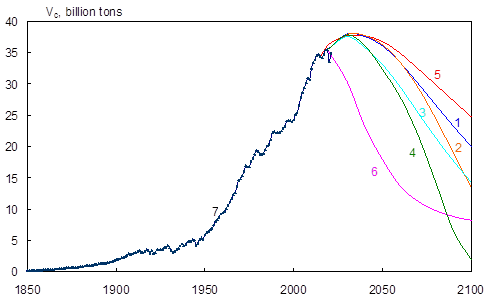
Fig.
4. Industrial emissions of CO2: projections of the present paper
for the demographic scenario options listed in Table 2 (1–4), ‘Paris’ reference
scenario (Klimenko et al. 2016a, 2016b) (5), ‘Glasgow’ scenario
(Klimenko et al. 2022a; Klimenko et al. 2023a) (6) together with historical data of CDIAC/UN/BP (7)
1.3. ‘Net Zero’
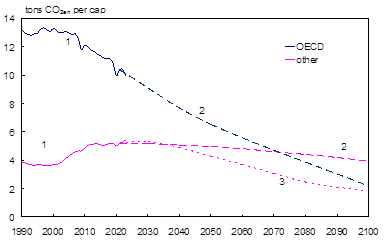
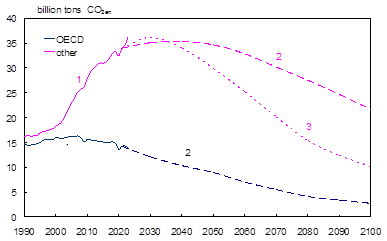
The regularities of decarbonisation of the energy industry and the overall economy in key OECD countries (USA, EU, Canada, Australia, Japan, Norway) and other countries (Russia, China, India, Indonesia, Brazil, Iran, Saudi Arabia) were studied in (Klimenko et al. 2024a; Klimenko et al. 2024b; Klimenko et al. 2024c). Based on the analysis of current trends in the dynamics of greenhouse gas (GHG) emissions for these countries, GHG emission scenarios have been developed for the period up to 2100. The share of the studied countries in their groups (OECD and other countries) in primary energy consumption, energy and total GHG emissions is within 60–85 per cent, which gives grounds to extend the obtained estimates to the rest of these groups.
A general approach to estimating future emissions is to extrapolate per capita emissions and calculate gross GHG emissions based on the UN median population scenario (World Population 2024).
For OECD countries, an extrapolation was made using the rates of decline
in specific GHG emissions characteristic of the last two decades (Klimenko et al. 2024b)
(Figure 5a). As a result, by the end of the century, this indicator will
decline by almost five times in developed countries, from 10 t CO2eq/cap
to 2 t CO2eq/cap, which, with minor changes in the population of these
countries, gives approximately the same reduction in the gross emissions (Figure
5b).
a
b
Fig.
5. Specific (a) and gross (b) total GHG emissions (excluding LULUCF and CCS)
in developed (OECD) and other countries: history according to WRI and UN data (1)
and NetZero Historical (2) and NetZero Intensive (3) scenarios from this work
A different procedure was used for other countries. The results of the studies (Klimenko et al. 2024d) yielded a dependence of the rate of reduction of national specific GHG emissions on the level of economic development, determined by the nominal value of GDP per capita. The regularities identified for seven representative countries (Russia, China, India, Indonesia, Brazil, Iran and Saudi Arabia) were applied to the whole group of developing countries and formed the basis of the ‘NetZero Historical’ scenario (Figure 5). Alternative scenarios for rapid decarbonisation have also been developed for China and India, which together account for 40 per cent of the global GHG emissions, based on the national energy transformation measures planned in these countries and considered in the International Energy Agency's STEPS4 scenario (IEA 2023). For developing countries, they are included in the ‘NetZero Intensive’ scenario (Figure 5).
In further calculations, the concept of net GHG emissions is applied, which describes anthropogenic carbon dioxide sinks from land use, land-use change, and forestry (LULUCF) and carbon dioxide capture and storage (CCS) technologies.
To assess the contribution of the LULUCF sector, changes in the land use structure in the countries of the studied groups were analyzed. The OECD countries demonstrate a gradual decrease in the area of agricultural lands and a slow restoration of forests, mainly through afforestation, which contributes to higher carbon dioxide absorption. In other countries, the opposite trends are evident: in general, deforestation continues and is not compensated by new plantings, and the area of agricultural land continues to grow, although this process is considerably slowed down by the development of agricultural technologies and an increase in agricultural productivity. However, we should note that this large group of countries is very inhomogeneous. Thus, in addition to countries with high rates of deforestation (such as Brazil and Indonesia), there are also countries wh ere the area of forest plantations is much greater than the area of deforestation (such as India and Iran) and, finally, China, which is the world leader in terms of the area of forest planted annually (Klimenko et al. 2024c).
It has been repeatedly pointed out previously (Chen and Wu 2022; Yang Shu et al. 2023; Akimoto et al. 2021; Filippov and Zhdaneev 2022) that climate neutrality cannot be attained in most countries of the world without the large-scale development of carbon dioxide capture and storage (CCS). Various estimates (Filippov and Zhdaneev 2022; Kearns et al. 2017) suggest that the world has sufficient geological resources to implement such projects.
These data were used as the basis for elaboration of two scenarios for the development of CCS: historical and intensive. The historical scenario envisages the achievement of carbon neutrality (taking into account CO2 capture in LULUCF) by the end of the next century. This requires the CCS capacity to grow at a rate of about 9 per cent per year (slightly lower than the current CCS growth rate of 11 %) over the next 50 years to reach about 7 Gt/year by 2100, which, together with approximately the same amount of sink due to LULUCF, makes it possible to achieve a net emission value of 10 Gt CO2eq compared to the total amount of GHG produced of 25 Gt CO2eq. Subsequently, the need for CCS decreases, allowing carbon neutrality (full compensation of emissions by sinks) to be achieved by 2200. In the period up to 2050, the path of this scenario lies between the moderate STEPS scenario (IEA 2023) and the Current Trajectory scenario (BP 2024) and almost matches the latter.
The intensive CCS development scenario is aimed at achieving negative GHG emissions (wh ere sinks exceed emissions in absolute terms) by the end of the current century and assumes that maintaining the current extremely high growth rate of about 11 % per year, reaching capacities of 10–11Gt CO2eq /year by 2075 and gradually declining to 2–3Gt CO2eq /year by the end of the next century. In 2050, the CCS capacities under this scenario are somewhat lower than the estimates of the revolutionary APS scenario (IEA 2023) and almost half of the estimates of the ‘zero’ Net Zero scenario (BP 2024), which essentially has no chance of being implemented from a historical point of view. It should be remembered that negative GHG emissions are a must if the global community intends to move from a growth to a decrease in global average temperature within a century.
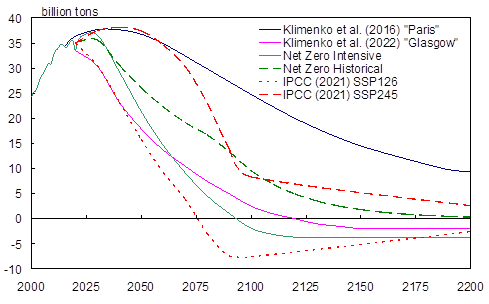
Fig.
6. Dynamics of industrial net emissions of carbon dioxide (including CCS) –
history (BP), scenarios: SSP1-2.6 and SSP2-4.5 (Gidden et al. 2019;
Meinshausen et al. 2019; IPCC 2021), and this work (Table
2)
Figures 6 and 7 compare the estimates of production and net emissions of greenhouse gases obtained in this work with the results of other studies carried out by leading global energy agencies [IEA 2023; BP 2024], as well as academic institutions within the scope of the IPCC activities [Gidden et al. 2019; Meinshausen et al. 2019; IPCC 2021].5
The time horizon of the energy forecasts (IEA 2023; BP 2024) is limited to 2050, therefore this time period is shown in Figure 7.
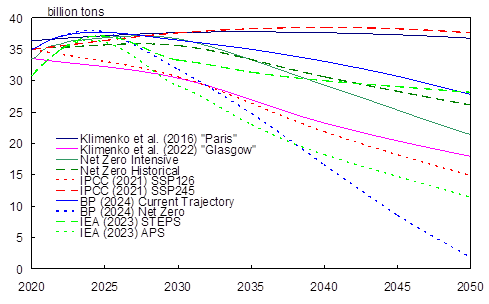
Fig.
7. Scenarios of industrial net-emission of carbon dioxide (considering CCS):
SSP1-2.6 and SSP2-4.5 (Gidden et al. 2019; Meinshausen et al. 2019), STEPS and APS (IEA 2023), Current
Trajectory and Net Zero (BP 2024), and this study (Table 2)
Despite the fundamental difference in approaches to simulating the development of energy and other areas of human activities, the scenarios for implementing the decisions of the UNFCCC Conferences of the Parties in Paris (2015) and Glasgow (2021) developed earlier by the authors of this paper, are consistent with the lower range SSP245 and SSP126 scenarios (Gidden et al. 2019; Meinshausen et al. 2019), respectively.
As to the estimates of this work, for the period up to 2050, they are found in a much narrower range, approximately halfway between the trajectories of SSP245 and SSP126. The ‘NetZero Historical’ scenario corresponds to the inertial forecasts STEPS (IEA 2023) and Current Trajectory (BP 2024) of the energy agencies that indicates a proper interpretation of the applicable trends in the global energy and the overall global economy within the scope of this work. Pronounced differences emerge when comparing more extreme scenarios. The APS (IEA 2023) and Net Zero (BP 2024) trajectories of fast decarbonisation assume excessive rates of reduction in the net GHG emissions, cutting them by several times (by three times for APS and more than ten times for Net Zero) in just two and a half decades. In such a system as inert as the world energy industry, such high rates of transformation can hardly be achieved at all.
Over a longer time period (to the end of this century and beyond – see Figure 6), the net GHG emission scenarios proposed here follow the trajectories of the long-term SSP scenarios. In fact, the emission value by 2100 under the NetZero Historical scenario is well in line with the SSP2-45 estimates, while under the NetZero Intensive scenario, just like in the SSP1-26 option, it falls into the negative area, but only 20 years later.
2. Model Projections for Global Climate Changes
Based on the estimates of net anthropogenic GHG emissions obtained using a combined climate model (Klimenko et al. 2017) coupled with a global carbon cycle model (Klimenko et al. 2020), simulations were performed for changes in the carbon dioxide concentration and global average temperature, and the predictions were compared with other scenarios – ‘Paris’ (Klimenko et al. 2016a, 2016b) and ‘Glasgow’ (Klimenko et al. 2022a; Klimenko et al. 2023a) scenarios, which assume the implementation of the decisions of the relevant Conferences of the Parties to the UNFCCC.
The simulations were performed using scenarios of net anthropogenic industrial emissions (emissions minus removals) (indCO2) and biotic CO2 fluxes (bioCO2), as well as radiative forcing of other GHGs (nonCO2) and tropospheric sulphate aerosol (TSA) of anthropogenic origin. In addition, the effect of fundamental natural factors such as solar and volcanic activity and quasi-periodic processes in the world ocean – atmosphere system, were considered.
The results of the simulations are summarized in Figure 8.
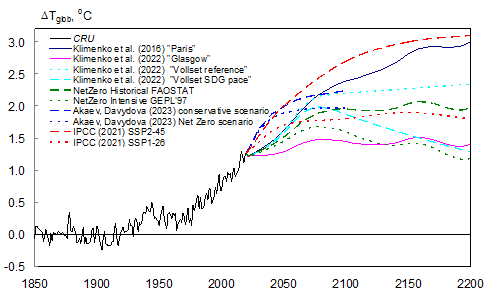
Fig.
8. Dynamics of the global average temperature (referenced to the average over
1850–1900) – history (CRU), model predictions according to scenarios from Table
2
and (IPCC 2021; Klimenko et al. 2016a, 2016b; Klimenko et al. 2022b;
Klimenko et al. 2023a; Akaev and
Davydova 2023)
According to the model projections, the Paris Agreement constraints do not prevent further temperature increases of up to 2.4 °C by the end of the twenty-first century and almost 3 °C by the end of the twenty-second century, and are absolutely insufficient. Meanwhile, as we have pointed out before (Klimenko et al. 2023a), even the relatively soft Paris Agreement limits are not being fully implemented today. As for the limits outlined in the Glasgow Pact, only their full and timely implementation will make it possible to keep warming within the desired 1.5 °C. However, an analysis of modern trends suggests that the Glasgow scenario only demonstrates such a possibility, but in fact it can hardly be implemented since the developing historical trends cannot be disrupted (Klimenko et al. 2022b; Klimenko et al. 2023a). At present, the most revolutionary NetZero Intensive scenario, in which the temperature passes a peak at around 1.8 °C at the end of this century and then drops to the current levels as a result of the removal of excess CO2 from the atmosphere, is still feasible. However, even if this most revolutionary scenario is implemented, the period of unsafe temperature exceedance, namely the residence time in the zone above 1.5 °C, will be longer than a century.
The results of model simulations of changes in the global mean temperature (MGT), performed with the authors' global climate system model suite and presented in Figure 8, are in good agreement with the estimates (IPCC 2021) obtained within the scope of the project for comparing the results of CMIP6 climate models for the corresponding scenarios. Thus, the growth of MGT under the Paris scenario broadly cor-relates to the SSP2-4.5 model simulations, according to which MGT will increase by 2 C by 2050 and by 2.7°C by 2100 compared to the pre-industrial levels. The simulation data for the NetZero Intensive scenario are close to the estimates for the SSP1-2.6 option, according to which MGT reaches a maximum of 1.7–1.8 °C above the pre-industrial levels in the second half of the current century.
The modeling results of conservative and NetZero scenarios of (Akaev and Davydova 2023) for the second part of the current century are very close to the simulations of ‘Vollset Reference’ and ‘Vollset SDG pace’ world depopulation scenarios from (Klimenko et al. 2022b) respectively. Also the NetZero scenario of (Akaev and Davydova 2023) demonstrates a similar climate effect to the NetZero Historical scenario of the present study with the FAOSTAT biotic carbon flux variant.
Thus, the historical-extrapolation approach developed by the authors for forecasting the development of the energy industry and other areas of human economic activities and their impact on the global climate system yields results that are quite consistent with the predictions of other methods of modeling socio-technical systems.
3. Possible Impact of Some Modern Aspects on Current and Future GHG Emissions
Today the world is experiencing a period of unprecedented geopolitical tension; comparable to the Caribbean or major oil crises (Korotayev and Khokhlova 2023). The most striking manifestation of the confrontation between the so-called ‘collective West’ and the ‘global South’ has become the recent military conflicts in Ukraine and the Middle East. Assessing their long-run consequences is currently quiet difficult. As for the immediate GHG emissions due to the military operations in the Ukrainian territory, a recent study (Bun et al. 2024) estimates them at 77 million tons of CO2eq for the first eighteen months, i.e. about 0.15 % of the global total. In addition, the reduction of Russian natural gas supplies to Europe has had a profound negative effect, which caused an increase in coal consumption and subsequent GHG emissions in the region.
At the same time, van Meijl et al. (2024) argue, based on model simulations, that in the long run
the Russia-Ukraine military conflict may lead to an additional reduction
in GHG emissions due to increased energy prices and a redistribution of export flows
which will result in a reduction in energy consumption and an accelerated transition
to renewable energy sources.
Now there is no doubt that modern shocks have significantly affected the path of the world development: from the version of ‘harmonious globalism’ (SSP1 – Sustainability. Taking the Green Road in the terms of [IPPC 2021]), the world is currently moving towards fragmentation (SSP3: Regional rivalry. A Rocky Road and SSP4: Inequality. A Road Divided). According to the model estimates [IPPC 2021], this could lead to a slowdown in the pace of global economic development and ensuing growth in energy consumption, as well as to a slowdown in the energy transition.
There is one more factor that can affect global development – the progress of digital technologies (Grinin L., and Grinin A. 2021). The development of AI, block chain processes, and mining have caused the rapid growth of large data centers. According to estimates (CBRE 2024), the total installed capacity of data centers in the world's largest clusters currently exceeds 10 GW, with an annual growth rate of 15–20 per cent. In Russia, about 0.7 GW of data center capacity was installed by the end of 2023, and the mining capacity in the country was estimated at 2.3 GW. Taking into account the high degree of load (80–90 %), they significantly increase electricity consumption and GHG emissions associated with electricity generation. However, the high density of waste heat fluxes from these centers contributes to their efficient use (Yakovlev and Avdokunin 2023), which significantly reduces the negative effect. In addition, the use of modern digital technologies accelerates scientific and technological progress (Grinin L., and Grinin A. 2021) and improves the energy and environmental performance of the economy (Cowls et al. 2023), which, in turn, ultimately also reduces the burden on the climate system.
In general, there are similarities between these two problems: an increase in GHG emissions in the short term and a decrease over a long time horizon.
4. Potential Consequences of Global Climate Changes and the Need to Build the Global Economy with Negative GHG Emissions
A comprehensive analysis of current changes in the global climate system suggests that even the modern world with a warming level of 1.2 °C is no longer a safe place to live. Recent estimates of damages from extreme weather events attributed to global warming show exorbitant figures of US$16.3 million per hour for 185 events and a total of US$4 trillion for the period 2000–2019 (Newman and Noy 2021). Of course, these figures are already higher now, considering the series of record-breaking temperatures, wildfires, floods, and droughts that occurred in the 2020s. The latest science warns of the risk of crossing various ‘tipping points’ beyond 1.5 °C, with potentially devastating consequences for global ecosystems, human health and security. By now, 16 so-called climate tipping points (CTPs), which are global or continental in scale, have been identified (Armstrong McKay et al. 2023). By CTPs, we mean such states of the climate system at which an abrupt large-scale, irreversible transformation can occur, without any potential for reversibility even after the removal of the external disturbance (at present, this is the anthropogenically induced accumulation of GHG in the atmosphere). The critical CTPs that can occur with a temperature increase of (1.5–2) °C are as follows:
– Collapse of the Greenland ice sheet;
– Collapse of the West Antarctic ice sheet;
– Die-off of the low-latitude coral reefs;
– Thawing of permafrost;
– Slowing down and collapse of the Atlantic Meridional Overturning Circulation
– Dieback of the Amazon rain forest and its transformation into a savanna-like state.
Observations over the last few decades have revealed clear indications of the initial activation of all listed CTPs, except for the last one, and there is a risk that the Greenland and West Antarctic ice sheets have already lost their stability and may partially collapse even at the current levels of warming (Armstrong McKay et al. 2023). The activation of any CTP is not an isolated event, but is likely to trigger the others. For example, permanently frozen soils contain a huge amount (1035 Gt C) of carbon and methane, the release of which into the atmosphere will inevitably amplify warming and trigger other CTPs, the collapse of the Greenland ice sheet will slow down the Atlantic Meridional Overturning Circulation, etc. Therefore, the world community is faced with the problem of preventing the occurrence of CTPs at a minimum level of warming, which is currently considered to be the threshold of 1 °C (Rockström et al. 2023). Hence, the below-listed problems of climate protection in the current and next centuries follow directly from this information:
– Take measures to reduce the temperature threshold to a level of 1 °C;
– Make the residence time in the unsafe zone above 1.5 °С as short as possible.
In solving these problems, the attainment of climate neutrality is not the final goal, but an intermediate one. The world community will have to build a new economy with negative GHG emissions (net carbon dioxide removal) during the current century. Now, since the residence time in the zone of dangerous overshoot 1.5 °C or even 1 °C extends over at least a century, the implementation of measures for adaptation of and compensation for inevitable losses comes to the fore. This is especially true for low- and middle-income countries, which are both the primary cause and the first victims of future climate change.
Conclusions
1. Both groups of countries – developed and developing – are far behind schedule in their emission control activities, and none of them can achieve the climate neutrality on schedule.
2. In several relevant areas of human activity that are characterized by high inertia (like energy industry, agriculture, forestry, and other industries), certain historical regularities are active, which prevent the desired transformations to be carried out at arbitrary paces.
3. Military conflicts and the development of digital technologies increase GHG emissions in the short term and reduce them over a long time horizon.
4. The climate protection goals set by UNFCCC participants exceed their historical ability to transform their economies even in the face of increasing climate risk.
5. The window of opportunity is closed. The 1.5 °C threshold for conditionally safe warming will inevitably be exceeded within the next decade, and even if the most revolutionary scenario for emissions control were to be implemented, the period of turbulent temperature overshoot would last for more than a century.
6. The focus of the global community's efforts should gradually shift from mitigation to adaptation to unprecedented climate conditions based on proactive measures.
Acknowledgments
The work
uses data from the United Nations Framework Convention on Climate Change (UNFCCC, https://unfccc.int/), the Climate
Research Centre of the University of East Anglia (CRU, https://crudata.uea.ac.uk/cru/data/temperature/), the European
Commission's Emissions Database for Global Atmospheric Research (EDGAR, https://
edgar.jrc.ec.europa.eu), the World Resources Institute's greenhouse gas emissions
database (WRI, https://www.wri.org/data/climate-watch-cait-country-greenhouse-gas-emis-sions-data),
the United Nations Forestry and Agriculture Organization (FAO, http:// www.fao.org/faostat/en/#data), the United Nations Population
Devision (UN, https://po-pulation.un.org/wpp/),
the Global Carbon Capture and Storage Institute (GCCSI, https:// www.globalccsinstitute.com).
Funding
This study has been carried out at the Institute of Geography of the Russian Academy of Sciences and funded by the Ministry of Education and Science of the Russian Federation (project No. 075-15-2024-554).
NOTES
1 Almost the only such exception is the penultimate report of the Intergovernmental Panel on Climate Change (IPCC 2018), which used an alternative demographic forecast from the Institute for Applied Systems Analysis (World Population 2014; KC and Lutz 2017).
2 Fertility is a key demographic factor, defined as the number of births per woman of reproductive age (15–49 years).
3 Tce (ton of coal equivalent) – energy unit, equivalent to 29.3 GJ (approximate calorific value of one ton of high quality coal).
4 The latest IEA forecast (IEA 2023) includes two scenarios for the development of global energy: STEPS (Stated Policies Scenario), which takes into account existing and pending climate protection measures, and APS (Announced Pledges Scenario), which assumes that national goals under the Paris Agreement will be achieved in full and on time.
5 With the publication of the IPCC's Sixth Assessment Report (IPCC 2021), a new group of SSP (‘Shared Socioeconomic Pathways’) scenarios of anthropogenic impacts on the atmosphere and climate has been developed, proposing different trajectories of greenhouse gas emission dynamics depending on the target level of impacts by 2100 and the paths of global socio-economic development (Gidden et al. 2019; Meinshausen et al. 2019). This paper deliberately does not consider the most severe of them – SSP3-7.0 and SSP5-8.5, which assume the maintenance and even acceleration of growth of anthropogenic emissions, as well as the unjustifiably optimistic SSP1-1.9, aimed at achieving global climate neutrality by 2050.
REFERENCES
Akaev, A. A., and Sadovnichii, V. A. 2010. Mathematical Model of Population Dynamics with the World Population Size Stabilizing about a Stationary Level. Doklady Mathematics 82 (3): 978–981. DOI: 10.1134/S1064562410060360.
Akaev, А., and Davydova, O. 2023. Climate and Energy: Energy Transition Scenarios and Global Temperature Changes Based on Current Technologies and Trends. In Sadov-nichy, V., Akaev, A., Ilyin, I., Malkov, S., Grinin, L., Korotayev, A. (eds.), Reconsidering the Limits to Growth. A Report to the Russian Association of the Club of Rome (pp. 53–70). Cham, Switzerland: Springer Nature Switzerland AG.
Akimoto, K., Sano, F., Oda, J., Kanaboshi, H., Nakano, Y. 2021. Climate Change Mitigation Measures for Global Net-Zero Emissions and the Roles of CO2 Capture and Utilization and Direct Air Capture. Energy and Climate Change 2: Id. 100057. DOI: 10. 1016/j.egycc.2021.100057.
Armstrong McKay, D. I., Staal, A., Abrams, J.F., Winkelmann, R., Sackschewski, B., Loriani, S., Fetzer, I., Cornell, S. E., Rockström, J., Lenton, T. M. 2022. Exceeding 1.5°С Global Warming could Trigger Multiple Climate Tipping Points. Science 377 (6611). doi: 10.1126/science.abn7950.
BP. 2024. Energy Outlook 2050. London: BP p.l.c.
Buettner, T. 2020. World Population Prospects – A Long View. Economie et Statistique / Economics and Statistics 520‑521: 9–27. DOI: 10.24187/ecostat.2020.520d.2030.
Bun, R., Marland, G., Oda, T., See, L., Puliafito, E., Nahorski, Z., Jonas, M., Kovalyshyn, V., Ialongo, I., Yashchun, O., Romanchuk, Z. 2024. Tracking Unaccounted Greenhouse Gas Emissions due to the War in Ukraine since 2022. Science of the Total Environment 914: Id. e169879. DOI: 10.1016/j.scitotenv.2024.169879.
CBRE. 2024. Global Data Center Trends 2024. CBRE Group, Inc. URL: https://www.cbre.com/insights/reports/global-data-center-trends-2024.
Chen, X., and Wu, X. 2022. The Roles of Carbon Capture, Utilization and Storage in the Transition to a Low-Carbon Energy System using a Stochastic Optimal Scheduling Approach. Journal of Cleaner Production 366: Id. 132860. DOI: 10.1016/j.jclepro. 2022.132860.
Cowls, J., Tsamados, A., Taddeo, M., Floridi, L. 2023. The AI Gambit: Leveraging Artificial Intelligence to Combat Climate Change – Opportunities, Challenges, and Recommendations. AI and Society : Knowledge, Culture and Communication 38: 283–307. DOI: 10.1007/s00146-021-01294-x.
Das, A., and Ghosh, A. 2023. Vision Net Zero: A Review of Decarbonisation Strategies to Minimise Climate Risks of Developing Countries. Environment, Development and Sustainability. DOI. 10.1007/s10668-023-03318-6.
Falk, J., Gaffney, O., Bhowmik, A. K., Borgström-Hansson, C., Pountney, C., Lundén, D., Pihl, E., Malmodin, J., Lenhart, J., Jónás, K., Höjer, M., Bergmark, P., Sareen, S., Widforss, S., Henningsson, S., Plitt, S., Shalit, T. 2018. Exponential Climate Action Roadmap. Stockholm: Future Earth.
Filippov, S. P., and Zhdaneev, O. V. 2022. Opportunities for the Application of Carbon Dioxide Capture and Storage Technologies in Case of Global Economy Decarbonization (review). Thermal Engineering 69 (9): 637–652. DOI: 10.1134/s0040601522090014.
Fragkos P., van Soest H. L., Schaeffer R., Reedman L., Köberle A. C., et al. 2021. Energy System Transitions and Low-Carbon Pathways in Australia, Brazil, Canada, China, EU-28, India, Indonesia, Japan, Republic of Korea, Russia and the United States. Energy 216: Id. 119385. DOI: 10.1016/j.energy.2020.119385.
Gidden M. J., Riahi, K., Smith, S. J., Fujimori, S., et al. 2019. Global Emissions Pathways under Different Socioeconomic Scenarios for Use in CMIP6: A Dataset of Harmonized Emissions Trajectories through the End of the Century. Geoscientific Model Development 12 (4): 1443–1475. DOI: 10.5194/gmd-12-1443-2019.
Grinin, L. E., and Grinin, A. L. 2021. Big History and the Cybernetic Revolution: The Technological Dimension. In Grinin, L., Ilyin, I. V., Korotayev, A. V. (eds.), Globalistics and Globalization Studies. Current and Future Trends in the Big History Perspective (pp. 291–312). Volgograd: ‘Uchitel' Publishing House.
IEA. 2020. Energy Technology Perspectives 2020. Paris: IEA.
IEA. 2023. World Energy Outlook 2023. Paris: IEA.
IPCC. 2018. Global Warming of 1·5°C. An IPCC Special Report on the Impacts of Global Warming of 1·5°C above Pre-industrial Levels and Related Global Greenhouse Gas Emission Pathways, in the Context of Strengthening the Global Response to the Threat of Climate Change, Sustainable Development, and Efforts to Eradicate Poverty. Geneva: World Meteorological Organization.
IPCC. 2021. Climate Change 2021: The Physical Science Basis. Contribution of Working Group I to the Sixth Assessment Report of the Intergovernmental Panel on Climate Change. Masson-Delmotte, V., Zhai, P., Pirani, A. et al. (eds.). Cambridge, United King-dom and New York, NY, USA: Cambridge University Press. DOI: 10.1017/978 1009157896.
KC, S., and Lutz, W. 2017. The Human Core of the Shared Socioeconomic Pathways: Population Scenarios by Age, Sex and Level of Education for all Countries to 2100. Global Environmental Change 42: 181–192. DOI: 10.1016/j.gloenvcha.2014.06.004.
Kearns J., Teletzke G., Palmer J., Thomann H., Kheshgi H., Yen-Heng C. H., Paltsev S., Herzoget H. 2017. Developing a Consistent Database for Regional Geologic CO2 Storage Capacity Worldwide. Energy Procedia 114: 4697–4709. DOI: 10.1016/j.egypro. 2017.03.1603.
King, D., Hill, A., Corell, R. W., Ye, Q., et al. 2023. The Overshoot: Crossing the 1.5 Threshold and Finding Our Way Back. Cambridge, UK: Climate Crisis Advisory Group.
Klimenko, V. V., and Tereshin, A. G. 2010. World Power Engineering and Global Climate after the Year 2100. Thermal Engineering 57 (12): 1035–1041. DOI: 10.1134/S004 0601510120074.
Klimenko, V. V., Mikushina, O. V., Tereshin, A. G. 1999. Do we Really Need a Carbon Tax? Applied Energy 64 (1–4): 311–316.
Klimenko V. V., Mikushina O. V., Tereshin A. G. 2016a. The 2015 Paris Agreement: A Turning Point in the World's Energy History. Doklady Physics 61 (6): 301–304. DOI:10.1134/S1028335816060070.
Klimenko, V. V., Klimenko, A. V., Mikushina, O. V., Tereshin, A. G. 2016b. To Avoid Global Warming by 2°C – Mission Impossible. Thermal Engineering 63 (9): 605–610. DOI: 10.1134/S0040601516090020.
Klimenko V. V., Mikushina O. V., Tereshin A. G. 2017. A Combined Model for Analysis and Projection of the Regional Air Temperature Dynamics. Proc. SPIE. 23rd International Symposium on Atmospheric and Ocean Optics: Atmospheric Physics. Id. 10466. DOI: 10.1117/12.2287753.
Klimenko, V. V., Mikushina, O. V., Tereshin, A. G. 2020. Dynamics of Biotic Carbon Fluxes under Different Scenarios of Forest Area Changes. Izvestiya, Atmospheric and Oceanic Physics 56 (4): 405–413. DOI: 10.1134/S0001433820040039.
Klimenko, V. V., Mikushina, O. V., Tereshin, A. G. 2022a. Glasgow-2021: The Difficult Road to the 1.5°C Goal. Doklady Physics 67 (7): 215–221. DOI: 10.1134/S10283 35822070023.
Klimenko, V. V., Klimenko, A. V., Mikushina, O. V., Tereshin, A. G. 2022b. Energy, Demography, and Climate: Is There an Alternative to Eliminating Fossil Fuels? Doklady Physics 67 (10): 433–438. DOI: 10.1134/S102833582210007X.
Klimenko, V. V., Klimenko, A. V., Tereshin, A. G., Mikushina, O. V. 2022c. Will the Energy Transition Be Able to Stop Global Warming and Why Are Climatic Forecasts so Erroneous? Thermal Engineering 69 (3): 149–162. DOI: 10.1134/S0040601522030065.
Klimenko, V. V., Klimenko, A. V., Tereshin, A. G., Mikushina, O. V. 2023a. Struggle for Climate Rescue: The Euphoria of Plans versus Cold Reality. Thermal Engineering 70 (3): 161–174. DOI: 10.1134/S0040601523030011.
Klimenko, V. V., Klimenko, A. V., Tereshin, A. G. 2023b. Carbon-free Russia: Is There a Chance to Achieve Carbon Neutrality by 2060. Doklady Physics 68 (7): 207–216. DOI: 10.1134/S1028335823070030.
Klimenko, V. V., Klimenko, A. V., Tereshin, A. G. 2024a. Towards Climate Neutrality: Will Russian Forest Stand Against Energy? Thermal Engineering 71 (1): 3–17. DOI: 10.1134/S0040601524010051.
Klimenko, V. V., Klimenko, A. V., Tereshin, A. G. 2024b. Prospects for Achieving Carbon Neutrality by Economically Developed Countries. Doklady Rossijskoj akademii nauk. Fizika, tehničeskie nauk. 517 (1): 71–80. DOI: 10.31857/S2686740024040116. (in Russian)
Klimenko, V. V., Klimenko, A. V., Tereshin, A. G. 2024c. Prospects for Achieving Carbon Neutrality by Developing Countries. Global Energy. 30 (3): 23–42. DOI: 10.18721/ JEST.30302. (in Russian)
Klimenko, V. V., Klimenko, A. V., Mikushina, O. V., Tereshin, A. G. 2024d. Zero Carbon World: is it Possible to Achieve Global Climate Neutrality? Thermal Engineering 71 (12): 1025–1037 DOI: 10.1134/S0040601524700605.
Korotayev, A. V., and Khokhlova, A. A. 2023. Sociopolitical Destabilization Dimensions in Comparative Global and Regional Perspective. In Grinin, L. E., Korotayev, A. V. (eds.), History & Mathematics: Entropy and Destabilization (pp. 174–213). Volgograd: ‘Uchitel’ Publishing House.
Makarov, A. A., Mitrova, T. A., Kulagin, V. A. 2020. Long-term Development of the Global Energy Sector under the Influence of Energy Policies and Technological Progress. Russian Journal of Economics 6 (4): 347–357. https://doi.org/10.32609/j.ruje.6.55196.
Meinshausen, M., Nicholls, Z. R. J., Lewis, J., Gidden, M. J., et al. 2019. The Shared Socio-Economic Pathway (SSP) Greenhouse Gas Concentrations and Their Extensions to 2500. Geoscientific Model Development 3: 3571–3605. DOI: 10.5194/gmd-13-3571-2020, 2020.
Newman, R., and Noy I. 2023. The Global Costs of Extreme Weather that are Attributable to Climate Change. Nature Communications 14 (6103). DOI: 10.1038/s41467-023-41888-1.
Olabi, A. G., and Abdelkareem, M. A. 2022. Renewable Energy and Climate Change. Renewable and Sustainable Energy Reviews 158: Id. 112111. DOI: 10.1016/j.rser. 2022.112111.
Rockström, J., Gupta, J., Qin, D. et al. 2023. Safe and Just Earth System Boundaries. Nature 619: 102–111. DOI: 10.1038/s41586-023-06083-8.
Schmidt, G. 2024. Why 2023's Heat Anomaly is Worrying Scientists. Nature 627: 467. doi:10.1038/d41586-024-00816-z.
Van Meijl, H., Bartelings, H., Van Berkum, S., Cui, H. D., Smeets Kristkova, Z., Van Zeist, W. J. 2024. The Russia-Ukraine War Decreases Food Affordability but could Reduce Global Greenhouse Gas Emissions. Communications Earth & Environment 5 (1): Id. 1234567890. DOI: 10.1038/s43247-024-01208-x.
Vatalis, K. I., Avlogiaris, G., Tsalis, T. Α. 2022. Just Transition Pathways of Energy Decarbonization under the Global Environmental Changes. Journal of Environmental Management 309: Id. 114713. DOI: 10.1016/j.jenvman.2022.114713.
Vollset, S. E., Goren E., Yuan C. W., Cao J., et al. 2020. Fertility, Mortality, Migration, and Population Scenarios for 195 Countries and Territories from 2017 to 2100: A Forecasting Analysis for the Global Burden of Disease Study. Lancet 396 (10258): 1285–1306. DOI: 10.1016/S0140-6736(20)30677-2.
World Population. 1981. World Population Prospects as Assessed in 1980. New York: UN.
World Population. 2014. World Population and Human Capital in the 21st Century. Lutz, W., Butz W. P., KC S. (Eds.). Oxford: Oxford University Press.
World Population. 2024. World Population Prospects 2024. New York: UN.
Yakovlev, I. V., and Avdokunin, N. V. 2023. Efficient Use of Waste Heat from Data Centers. Thermal Engineering 70 (1): 769–776. DOI: 10.1134/s0040601523100117.
Yang Shu, D., Deutz, S., Winter, B. A. Baumgärtner, N., Leenders, L., Bardow, A. 2023. The Role of Carbon Capture and Storage to Achieve Net-Zero Energy Systems: Trade-offs between Economics and the Environment. Renewable and Sustainable Energy Reviews 178: Id. 113246. DOI: 10.1016/j.rser.2023.113246.